- Analytics
- Technical Analysis
CORN Technical Analysis - CORN Trading: 2019-01-22
China may increase US corn purchases
The cost of cereal crops slightly increased at the end of the regular round of US-China trade negotiations. Will corn prices rise?
It is supposed that China will increase imports of US goods, including soybeans and corn. However, the parties have not reached a full agreement yet. China offers to establish trade parity by 2024, and the US insists on earlier terms. The next negotiations will take place on January 30-31, 2019. An emerging increase in global demand for corn can be noted. Its imports to the EU since the beginning of the 2018/19 agricultural season, which started in July, have exceeded the volume of the corresponding period of the previous season by already 45% and reached 13.4 million tons. Turkey purchased 342 thousand tons of corn in an international tender. Market participants note good demand from South Korea. An additional factor in the possible growth of quotations may be the drought in Brazil and heavy rains in Argentina. Bad weather can reduce the corn yield in South America.
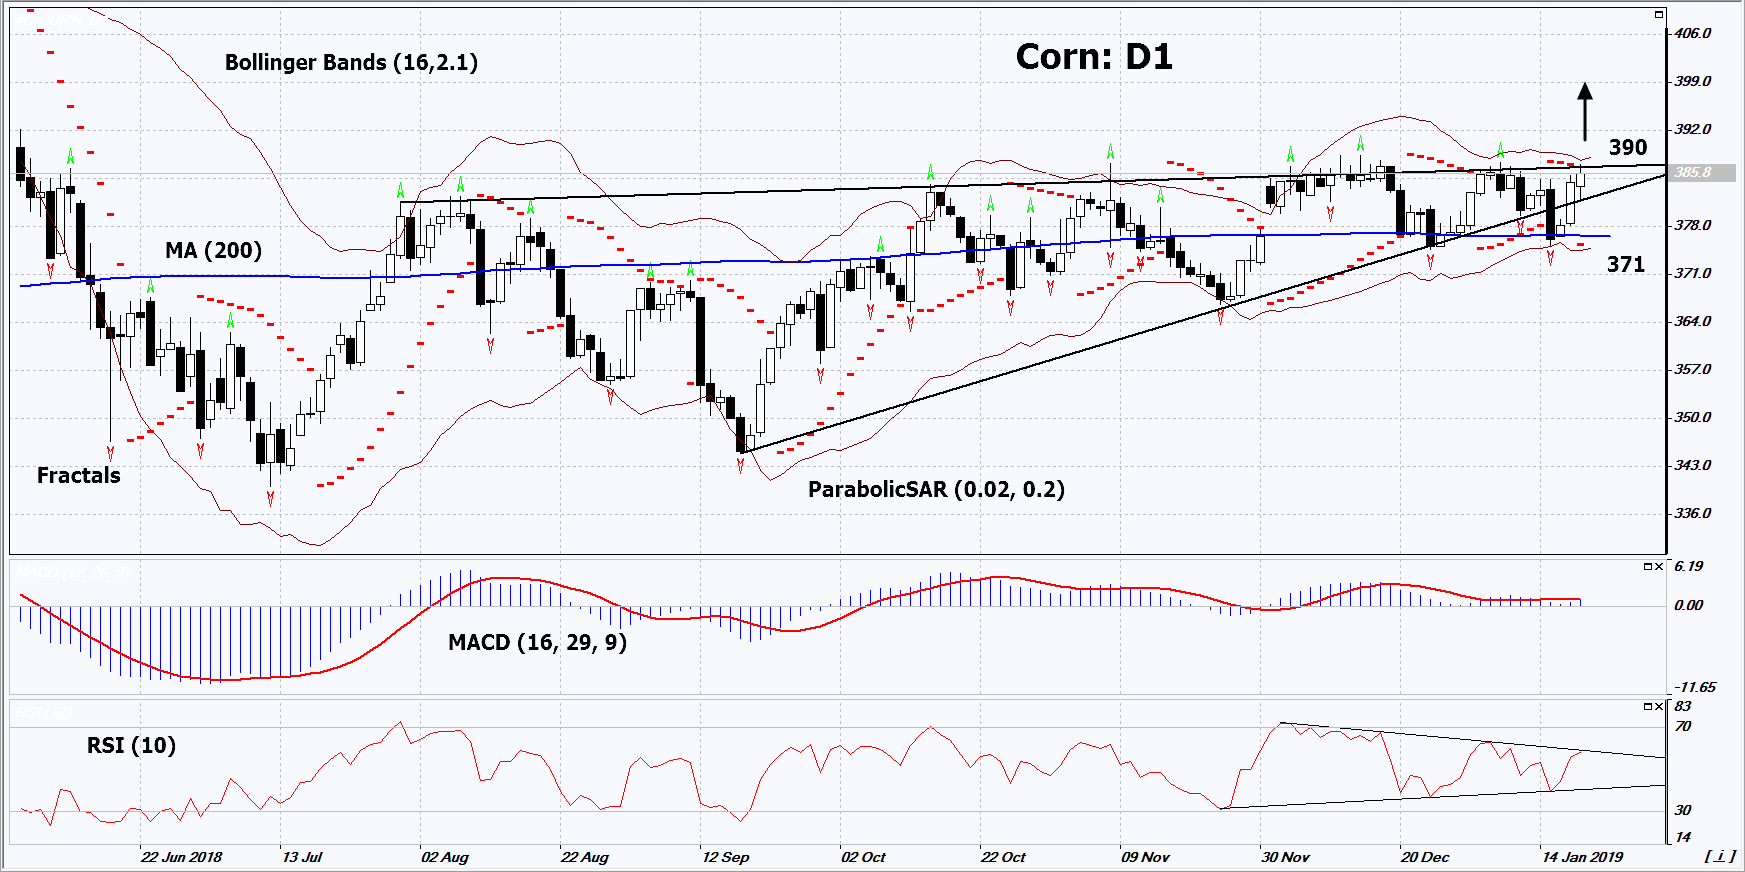
On the daily timeframe, Corn: D1 approached the resistance line of the triangle. It should be breached up, before opening a buy position. A number of technical analysis indicators formed buy signals. The further price growth is possible in case of an increase in demand and a reduction in world yield.
- The Parabolic indicator gives a bullish signal.
- The Bollinger bands have narrowed, which indicates low volatility. Both Bollinger bands are titled upwards.
- The RSI indicator is above 50. No divergence.
- The MACD indicator gives a bullish signal.
The bullish momentum may develop in case Corn exceeds the two last fractal highs and the upper Bollinger band at 390. This level may serve as an entry point. The initial stop loss may be placed below the two last fractal lows, the Parabolic signal, the 200-day moving average line and the lower Bollinger band at 371. After opening the pending order, we shall move the stop to the next fractal low following the Bollinger and Parabolic signals. Thus, we are changing the potential profit/loss to the breakeven point. More risk-averse traders may switch to the 4-hour chart after the trade and place there a stop loss moving it in the direction of the trade. If the price meets the stop level (371) without reaching the order (390), we recommend to close the position: the market sustains internal changes that were not taken into account.
Summary of technical analysis
| Position | Buy |
| Buy stop | Above 390 |
| Stop loss | Below 371 |
- Get Certificate

Note:
This overview has an informative and tutorial character and is published for free. All the data, included in the overview, are received from public sources, recognized as more or less reliable. Moreover, there is no guarantee that the indicated information is full and precise. Overviews are not updated. The whole information in each overview, including opinion, indicators, charts and anything else, is provided only for familiarization purposes and is not financial advice or а recommendation. The whole text and its any part, as well as the charts cannot be considered as an offer to make a deal with any asset. IFC Markets and its employees under any circumstances are not liable for any action taken by someone else during or after reading the overview.
