- Analytics
- Technical Analysis
GBP/USD Technical Analysis - GBP/USD Trading: 2014-12-24
Unemployment Claims
Today we consider GBP/USD currency pair on the H4 chart. The price is moving within the limits of H4, D1 and W1 downtrend channel: bearish trend is observed for all the timeframe scales. ParabolicSAR historical values are moving along the H4 trend line, confirming the investor sentiment. Donchian Channel is also demonstrating the negative bias. There is no contradiction on the part of the RSI-Bars oscillator: it indicated the daily downtrend. The final bearish confirmation will be obtained when the oscillator bar would cross the support level at 21.9462%. It will likely to coincide with the price breakout at 1.54803. This level is confirmed by the Donchian Channel lower boundary. This mark can be used for opening a pending sell order with Stop Loss placed above the resistance at 1.56163. This is a comfortable position for risk mitigation because the resistance level is strengthened by Parabolic historical values and the D1 trend line. We expect a new volatility momentum of this currency pair after the US Unemployment Claims being released at 14:30 (CET).
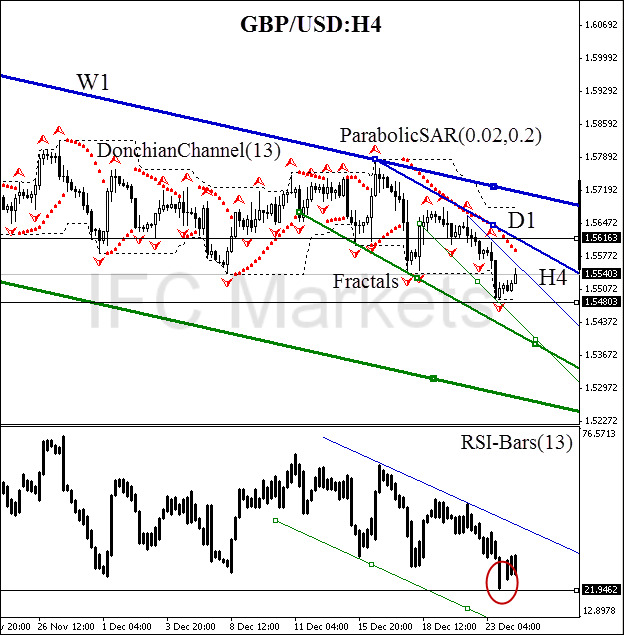
| Position | Sell |
| Sell stop | below 1.54803 |
| Stop loss | above 1.56163 |
Dear traders. For the detailed report of the strategy based on analytical issues of technical analysis click here.
- Get Certificate

Note:
This overview has an informative and tutorial character and is published for free. All the data, included in the overview, are received from public sources, recognized as more or less reliable. Moreover, there is no guarantee that the indicated information is full and precise. Overviews are not updated. The whole information in each overview, including opinion, indicators, charts and anything else, is provided only for familiarization purposes and is not financial advice or а recommendation. The whole text and its any part, as well as the charts cannot be considered as an offer to make a deal with any asset. IFC Markets and its employees under any circumstances are not liable for any action taken by someone else during or after reading the overview.
