- Analytics
- Technical Analysis
USDIDX Technical Analysis - USDIDX Trading: 2018-02-22
Rate hike expectations support US Dollar Index
Positive data and rate hike expectations support US dollar. Will the USDIDX continue advancing?
US treasury yields rose in the auction of 2-year paper on Tuesday. The central bank will auction additionally $35 billion of 5-year notes and $29 billion of 7-year notes this week. Markets are giving more consideration to the bullish impact of the US budget and trade deficits on treasury yields: deficits will have to be financed by increasing borrowings to implement Trump administration’s expansionary policies. Rising yields are bullish for dollar. At the same time economic data also indicate signs of inflation pick up. Thus, producer prices in the United States increased 2.7% in January of 2018 over the same month in the previous year, up from 2.6% in December. Core inflation rate ticked up to 0.3% over month from 0.2%. And Fed is expected to lift interest rates at its next meeting in March. Rising inflation and a rate hike expectation are bullish for the dollar index.
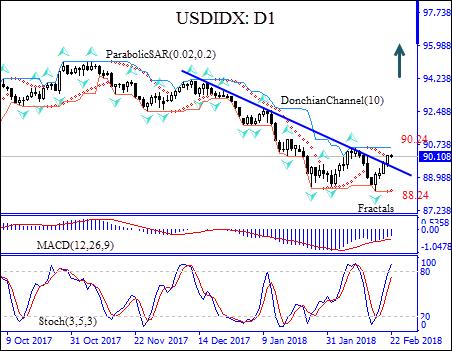
On the daily timeframe the USDIDX: D1 has been rising after hitting 38-month low a week ago. It has closed above the resistance line.
- The Parabolic indicator gives a buy signal.
- The Donchian channel indicates no trend yet: it is flat.
- The MACD indicator gives a bullish signal: it is below the signal line and the gap is narrowing.
- The Stochastic oscillator has breached into the overbought zone, it is a bearish signal.
We expect the bullish momentum will be maintained as the price continues advancing above the resistance line. A price above this line can be used as an entry point for a pending order to buy. The stop loss can be placed below the fractal low at 88.24. After placing the pending order, the stop loss is to be moved to the next fractal low, following Parabolic signals. By doing so, we are changing the probable profit/loss ratio to the breakeven point. If the price meets the stop loss level (88.24) without reaching the order, we recommend canceling the order: the market sustains internal changes which were not taken into account.
Technical Analysis Summary
| Position | Buy |
| Buy stop | Above 90.24 |
| Stop loss | Below 88.24 |
- Get Certificate

Note:
This overview has an informative and tutorial character and is published for free. All the data, included in the overview, are received from public sources, recognized as more or less reliable. Moreover, there is no guarantee that the indicated information is full and precise. Overviews are not updated. The whole information in each overview, including opinion, indicators, charts and anything else, is provided only for familiarization purposes and is not financial advice or а recommendation. The whole text and its any part, as well as the charts cannot be considered as an offer to make a deal with any asset. IFC Markets and its employees under any circumstances are not liable for any action taken by someone else during or after reading the overview.
