- Trading Platforms
- Platforms
- User Manuals
- NetTradeX iOS User Guide
- Opening a Chart
Opening a Chart
1. Opening a chart
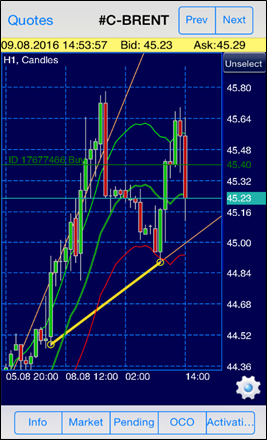
You may open the chart of an instrument by clicking on the line of this instrument in "Quotations" window. Chart example:
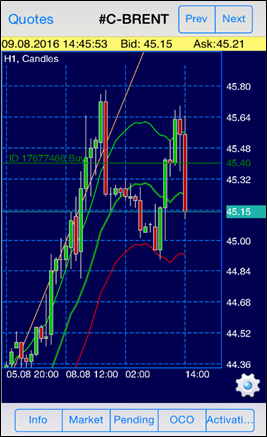
You may move the chart by moving your finger left or right. If you slide over the timeframe, the chart will change depending on the direction of the movement. The finger movement across the price scale vertically squeezes or extends the chart.
2. Chart settings
In the lower part of the chart window the panel with five buttons is situated as well as the button to set the chart parameters in the form of a gear icon. When clicking on this button the additional window of settings opens:
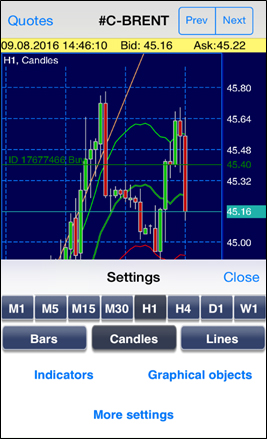
In this window you may choose the chart timeframe, set indicators and graphical objects.
3. Indicators
Through "Indicators" function you may open the window to set indicators for technical analysis and modify those that are already set:

In this window you may do the following:
- "Edit" button to delete indicators;
- "Add" button to set new indicators;
- by clicking on the line of an indicator you may change its parameters;
- "Chart" button to return back to the chart window.
"Add" button opens the window with the groups of indicators:
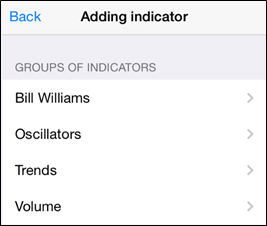
For example, let's choose, the "Oscillators" group - a window with indicators of this group will open:
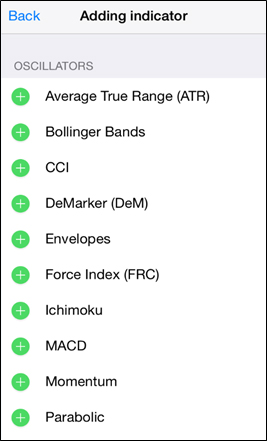
Let's choose the "Envelopes" indicator and set its numerical and color parameters:
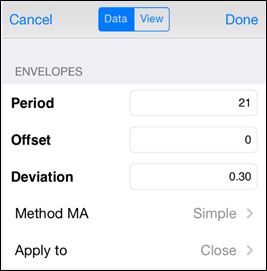
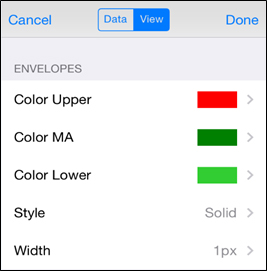
The "Done" button will display the indicator on the chart.
4. Graphical objects
Through "Graphical objects" function called by the button in the form of a gear you may open the window to set graphical objects and modify those that are already set:
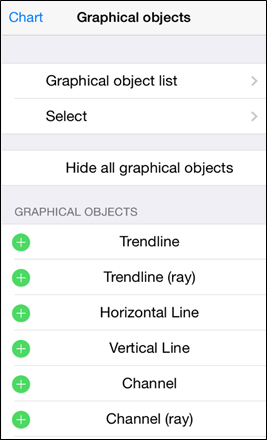
Having chosen, for instance, "Trendline (ray)" we will see the chart with a trend line in active navigation mode, that can be moved by a finger placed on an endpoint of a segment or on its midpoint:
To transfer the object from active mode to the usual one choose any of the options below:
- click on "Unselect" button in upper- right corner of the vertical chart scale;
- hold the object with a finger for a couple of seconds and choose the "Unselect" function in the opened context window;
- in the menu of graphical objects choose the "Select" function, tick the needed object and click on "Unselect all".
Delete the graphical object or transfer it into an active mode in the context menu or through the menu of graphical objects.