- Trading Platforms
- Platforms
- User Manuals
- NetTradeX Mobile User Guide
- Opening a Chart
Opening a Chart
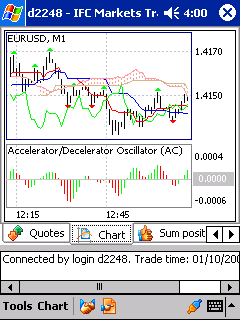
To open a chart you should click "Chart" at the bottom of the screen. In the context menu you can choose a currency pair (function "Currency"), period (function "Interval") and the type of presentation (a function "Type"). In choosing any of the these options will be displayed chart.
The bookmarks "Chart" appears in the horizontal list at the bottom of the screen when the chart is formed. Only one chart can be formed.
You can set (by the menu of the button "Chart") properties of the chart and add graphical objects. By command "Graphical Objects List" you can receive a list of objects and edit or delete it. To move the object to it must be put stylus (selected foreground appears object color and icons).

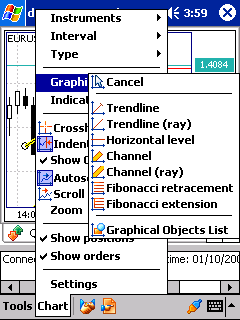
To set an indicator click on 'Indicators' in the 'Chart' menu. You will see 2 windows, the bottom part contains the list of all available technical indicators grouped into 4 blocks - Bill Williams, Oscillators, Trends and Volume.
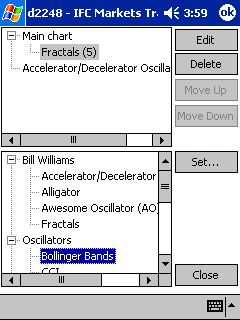
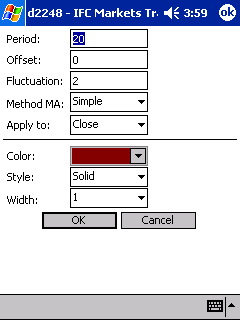
Click on the indicator you wish to apply and press 'Set'. Enter the parameteres of the indicator and press 'OK '.
The line containing the selected indicator will be shown in top of the window. You can remove, edit and replace each indicator from the list using 'Edit', 'Delete', 'Move up' and 'Move down' buttons. Press 'Close' and the selected indicator will be displayed on the chart or in the field below.