

- Analytics
- Market Data
- Currency Rates
- USD NOK Live Chart
USD NOK Free Forex Price Chart
This page includes full information about the USD/NOK, including the Dollar to Krona Norwegia live chart and dynamics on the chart by choosing any of 8 available time frames. As of Oct 25, the live USD/NOK rate is 9.32118.
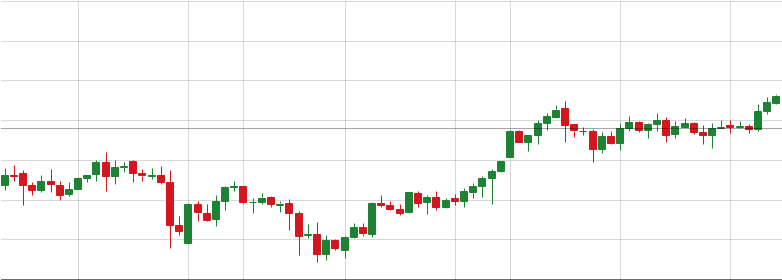
USD NOK Live Chart
- 1m
- 5m
- 15m
- 30m
- 1h
- 4h
- 1d
- 1w
The Price of USD/NOK is Falling This Week
USD/NOK is currently trading at 9.32118, down 0.01% since yesterday. Looking at broader trends, it's shifted 0.23% this week and 0.27% over the last 30 days.
| Select Period or Date Range | Open price | Change % |
|---|---|---|
| Daily | 9.3204 | 0.01% |
| Weekly | 9.38366 | 0.23% |
| Monthly | 9.50986 | 0.27% |
Technical Analysis
Technical analysis is a method of studying and evaluating market dynamics based on the price history. Its main purpose is to forecast price dynamics of a financial instrument in future through technical analysis tools. Technical analysts use this method of market analysis to forecast the prices of different currencies and currency pairs. This type of the analysis will allow you to make market forecast based on studying historical prices of the trading instruments.
See also latest technical analysis of the price dynamics of Dollar Krona Norwegia: USDNOK forecast.