- Analytics
- Technical Analysis
AUD/USD Technical Analysis - AUD/USD Trading: 2018-04-13
Positive data bullish for AUDUSD
February retail sales and trade surplus were higher than expected. Will the AUDUSD advance continue?
The Reserve Bank of Australia left the interest rate at 1.5% and the policy unchanged at its April 3 meeting. Australian economic data have been mostly better than expected recently: retail sales growth accelerated in February, increasing above expected 0.6% on month after 0.5% growth in January. And while the balance of trade surplus slipped in February the decline was smaller than expected, and the AIG/Housing Industry Association Australian Performance of Construction Index rose to 57.2 in March from 56.0 a month earlier. Positive data are bullish for AUDUSD. However deterioration of consumer confidence after marginal decline in Westpac Consumer Confidence Index in April to 102.4 from 103 a month earlier, and expected rise in unemployment rate to 5.6% in March from 5.5% due to be released on April 19 2018 pose downside risks for Australian dollar.
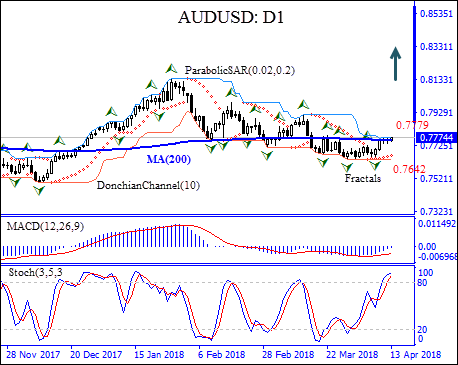
On the daily timeframe AUDUSD: D1 is retracing higher after hitting thirty-five-month high in the end of January. The price has breached above the 200-day moving average MA(200).
- The Parabolic indicator has formed a buy signal.
- The Donchian channel indicates no trend yet: it is flat.
- The MACD indicator is below the signal line with the gap narrowing. This is a bullish signal.
- The stochastic oscillator is in the overbaught zone, this is a bearish signal.
We believe a bullish momentum will continue after the price breaches above the upper Donchian boundary at 0.7779. This level can be used as an entry point for placing a pending order to buy. The stop loss can be placed below the lower Donchian channel at 0.7642. After placing the pending order the stop loss is to be moved every day to the next fractal low, following Parabolic signals. Thus, we are changing the probable profit/loss ratio to the breakeven point. If the price meets the stop-loss level (0.7642) without reaching the order (0.7779) we recommend cancelling the order: the market sustains internal changes which were not taken into account.
Technical Analysis Summary
| Position | Buy |
| Buy Stop | Above 0.7779 |
| Stop loss | Below 0.7642 |
- Get Certificate

Note:
This overview has an informative and tutorial character and is published for free. All the data, included in the overview, are received from public sources, recognized as more or less reliable. Moreover, there is no guarantee that the indicated information is full and precise. Overviews are not updated. The whole information in each overview, including opinion, indicators, charts and anything else, is provided only for familiarization purposes and is not financial advice or а recommendation. The whole text and its any part, as well as the charts cannot be considered as an offer to make a deal with any asset. IFC Markets and its employees under any circumstances are not liable for any action taken by someone else during or after reading the overview.
