- Analytics
- Technical Analysis
Cocoa Technical Analysis - Cocoa Trading: 2019-09-09
Cocoa Tree Disease in West Africa
Cocoa Research Institute of Ghana lowered its forecast for cocoa harvest in Ghana by 11% due to the viral disease of the trees Cacao swollen-shoot virus (CSSV). Will the cocoa quotations grow?
The number of infected trees in Ghana is estimated at 16%. This country produces 24% of the world's cocoa and another 35% falls on its neighboring Côte d'Ivoire. In total, three quarters of the world's cocoa is grown in Africa. An additional negative for the crop can be very rainy weather in West Africa. Meanwhile, the European Cocoa Association announced an increase in demand for beans in Europe and an increase in the volume of their processing in the 1st quarter of this year by 3.3% to 370.3 thousand tons compared to the same quarter last year.
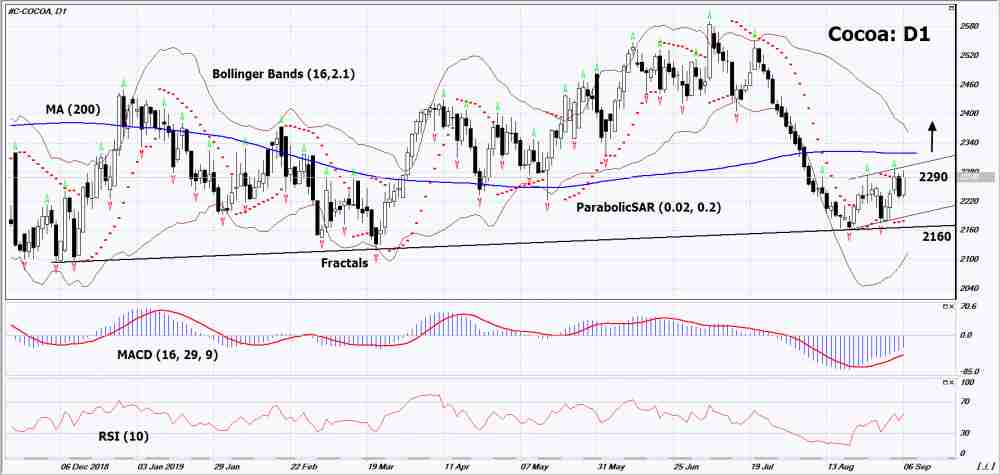
On the daily timeframe Cocoa: D1 could not break the lower bound of a long-term uptrend. Now it is adjusted up. Various technical analysis indicators have generated signals to increase. Further growth of quotations is possible in case of bad weather and a reduction in world crop .
- The Parabolic indicator demonstrates a signal to increase.
- The Bolinger bands widened, indicating high volatility. The bottom line of the Bollinger has a slope up.
- TheRSI indicator is above the mark of 50. Divergence is not observed.
- The MACD indicator gives a bullish signal.
The bullish momentum may develop if Cocoa exceeds the last upper fractal: 2290. This level can be used as an entry point. The initial stop lose may be placed below the last two lower fractals and the Parabolic signal: 2160. After opening the pending order, stop shall be moved following the Bollinger and Parabolic signals to the next fractal minimum. Thus, we are changing the potential profit/loss to the breakeven point. More risk-averse traders may switch to the 4-hour chart after the trade and place a stop loss moving it in the direction of the trade. If the price meets the stop level (2160) without reaching the order (2290), we recommend to cancel the order: the market sustains internal changes that were not taken into account.
Technical Analysis Summary
| Position | Buy |
| Buy stop | Above 2290 |
| Stop loss | Below 2160 |
Explore our
Trading Conditions
- Spreads from 0.0 pip
- 30,000+ Trading Instruments
- Stop Out Level - Only 10%
Ready to Trade?
Open Account Note:
This overview has an informative and tutorial character and is published for free. All the data, included in the overview, are received from public sources, recognized as more or less reliable. Moreover, there is no guarantee that the indicated information is full and precise. Overviews are not updated. The whole information in each overview, including opinion, indicators, charts and anything else, is provided only for familiarization purposes and is not financial advice or а recommendation. The whole text and its any part, as well as the charts cannot be considered as an offer to make a deal with any asset. IFC Markets and its employees under any circumstances are not liable for any action taken by someone else during or after reading the overview.
