- Analytics
- Technical Analysis
COPPER Technical Analysis - COPPER Trading: 2016-08-18
Copper is falling as global economy weakens
Copper prices are falling as global economic growth and industrial production are slowing down in many countries. Many traders note that copper has already twice tested its 200-day moving average but failed to break down thought it. They believe this level is key and if it is broken through the hedge funds may start selling copper futures. Will copper prices edge lower?
Stronger US dollar, if the Fed hikes the rates, may become additional negative for copper. Moreover, China raised the copper production by 9.6% this July compared to July 2015 to 722 thousand tonnes. Last week the net longs in copper at LME fell 5%. The gross longs are 115.2 while the gross shorts are 73.5. One lot accounts for 25 tonnes. China consumes about 45% of global copper so its economic data may have effect on copper prices. The next significant data, the manufacturing PMI, will be released in China only on September 1.
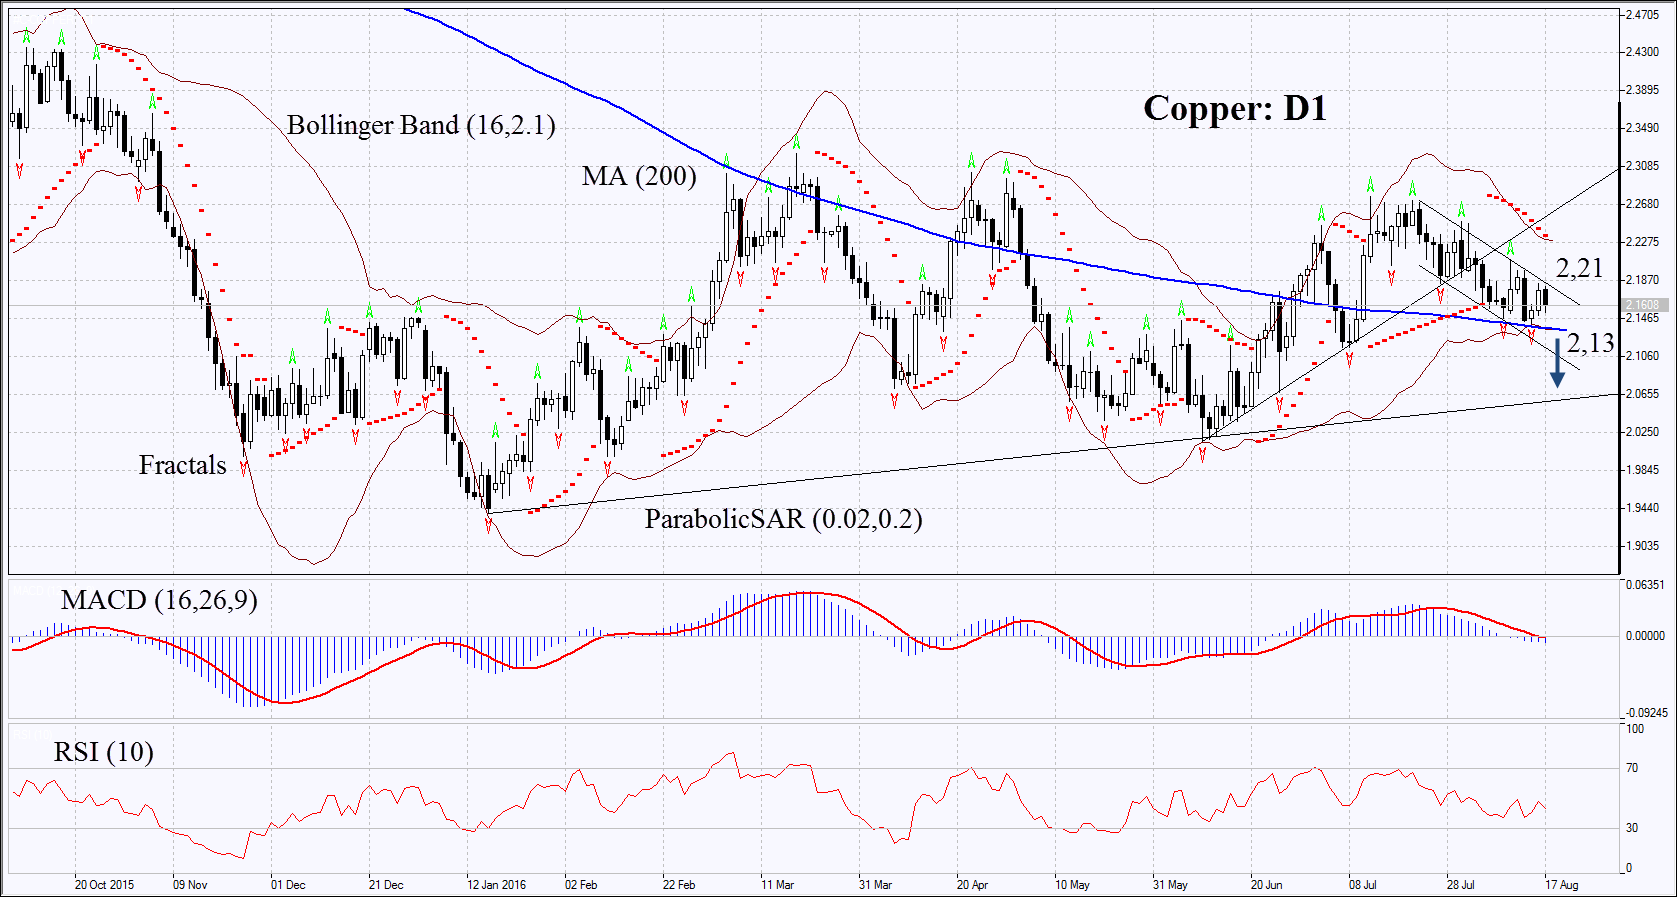
On the daily chart Copper: D1 is within the descending channel having tested already twice the 200-day moving average which is being the strong level of support. Theoretically, the fall may accelerate if the line is broken through. The MACD and Parabolic indicators have formed signals to sell. The Bollinger bands have narrowed a lot which means lower volatility. RSI is below 50 but has not yet reached the oversold zone, no divergence. The bearish momentum may develop in case the copper falls below the two last fractal lows and the Bollinger band at 2.13. This level may serve the point of entry. The initial stop-loss may be placed above the last fractal high and the line of the formed descending channel at 2 21. Having opened the pending order we shall move the stop to the next fractal high following the Parabolic and Bollinger signals. Thus, we are changing the probable profit/loss ratio to the breakeven point. The most risk-averse traders may switch to the 4-hour chart after the trade and place there a stop-loss moving it in the direction of the trade. If the price meets the stop-loss level at 2.21 without reaching the order at 2.13, we recommend cancelling the position: the market sustains internal changes which were not taken into account.
| Position | Sell |
| Sell stop | below 2.13 |
| Stop loss | above 2.21 |
Explore our
Trading Conditions
- Spreads from 0.0 pip
- 30,000+ Trading Instruments
- Stop Out Level - Only 10%
Ready to Trade?
Open Account Note:
This overview has an informative and tutorial character and is published for free. All the data, included in the overview, are received from public sources, recognized as more or less reliable. Moreover, there is no guarantee that the indicated information is full and precise. Overviews are not updated. The whole information in each overview, including opinion, indicators, charts and anything else, is provided only for familiarization purposes and is not financial advice or а recommendation. The whole text and its any part, as well as the charts cannot be considered as an offer to make a deal with any asset. IFC Markets and its employees under any circumstances are not liable for any action taken by someone else during or after reading the overview.
