- Analytics
- Technical Analysis
EUR/GBP Technical Analysis - EUR/GBP Trading: 2018-09-12
Weaker German data and improving UK figures bearish for EURGBP
German balance of trade surplus fell while UK’s deficit narrowed in July. Will the EURGBP slide continue?
Recent data indicate German economy is slowing due to global trade war uncertainty whereas UK indicators are improving together with increasing hope of Brexit deal in coming weeks. Thus, the German balance of trade surplus declined sizably to €16.5 billion in July from €21.8 in June as the current account surplus recorded an even steeper decline, accompanied by accelerated reduction in industrial output. Meanwhile the UK trade deficit narrowed drastically to £111 million in July from £942 million in June. And while the UK industrial output expansion slowed it still recorded 0.1% on month growth. At the same time wage growth accelerated in July. Weaker German data while UK figures are improving are bearish for EURGBP.
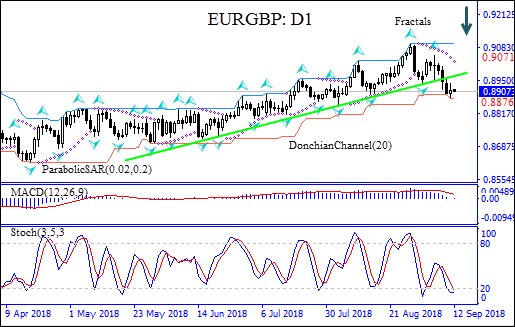
On the daily timeframe EURGBP: D1 has breached below the support line.
- The Parabolic indicator has formed a sell signal.
- The Donchian channel indicates downtrend : it is widening down.
- The MACD indicator gives a bearish signal.
- The stochastic oscillator is in the oversold zone, this is a bullish signal.
We believe the bearish momentum will continue after the price breaches below the lower Donchian boundary at 0.8876. This level can be used as an entry point for placing a pending order to sell. The stop loss can be placed above the last fractal high at 0.9071. After placing the pending order the stop loss is to be moved every day to the next fractal high, following Parabolic signals. Thus, we are changing the probable profit/loss ratio to the breakeven point. If the price meets the stop-loss level (0.9071) without reaching the order (0.8876) we recommend cancelling the order: the market sustains internal changes which were not taken into account.
Technical Analysis Summary
| Position | Sell |
| Sell Stop | Below 0.8876 |
| Stop loss | Above 0.9071 |
Explore our
Trading Conditions
- Spreads from 0.0 pip
- 30,000+ Trading Instruments
- Stop Out Level - Only 10%
Ready to Trade?
Open Account Note:
This overview has an informative and tutorial character and is published for free. All the data, included in the overview, are received from public sources, recognized as more or less reliable. Moreover, there is no guarantee that the indicated information is full and precise. Overviews are not updated. The whole information in each overview, including opinion, indicators, charts and anything else, is provided only for familiarization purposes and is not financial advice or а recommendation. The whole text and its any part, as well as the charts cannot be considered as an offer to make a deal with any asset. IFC Markets and its employees under any circumstances are not liable for any action taken by someone else during or after reading the overview.
