- Analytics
- Technical Analysis
EUR/USD Technical Analysis - EUR/USD Trading: 2014-10-09
Euro Against the US dollar
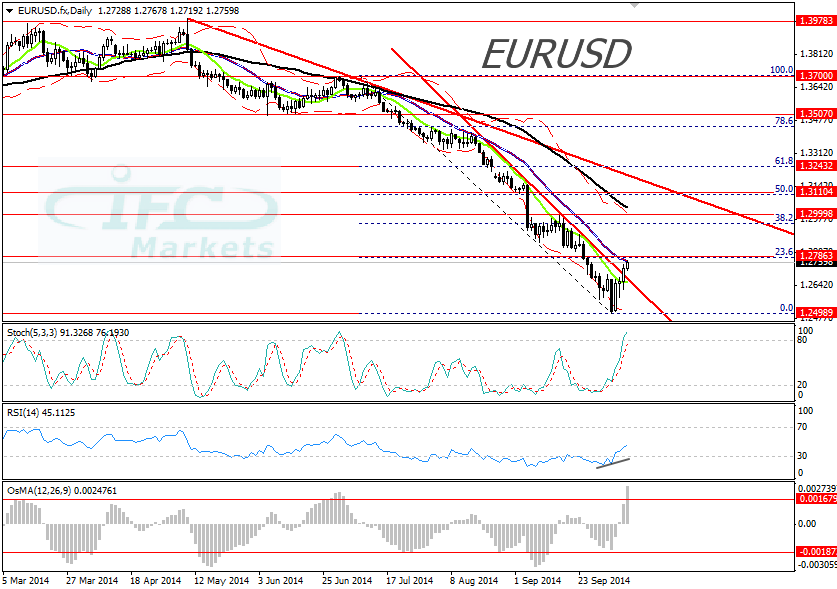
Hello, dear traders. Today we are going to analyze the Euro against the US dollar forex pair. As we can see at the price chart the currency pair is in a down trend as indicated by the declining trend lines. The currency pair dropped to a more than 2-year low at 1.2498 and bounced up breaching yesterday the steepest downward trend line and the 10-day Moving Average, indicating that corrective move could go higher. Prices are currently limited by the 20 Moving Average and by the 23.6% Fibonacci retracement at 1.2786. The bounce up from 1.2498 to 1.2786 has been the strongest recovery since the first of July. Moreover, prices have declined almost 10% since the beginning of July, from 1.37 to 1.2498 and that creates expectations for a deep retracement which could go as high as 1.3243.
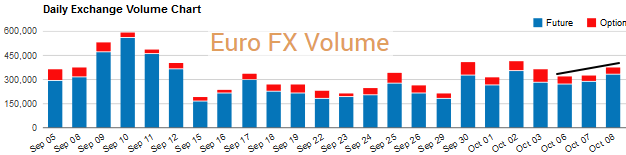
Furthermore, at the below chart we can see the daily volumes of futures and options traded on the Chicago Mercantile Exchange. We can see that since October the 6th the volume has been rising slightly while the EURUSD prices were recovering from more than 2-year low at 1.2498. That suggests bears are covering their short positions and they collect their profits, therefore we see some normalization of the relations between bears and bulls which mean the retracement is validated.
Looking at the oscillators, we observe that the Stochastic is already overbought as well as the OsMA has risen above previous peaks line while price pattern is in downtrend. This is a strong warning by short term oscillators that the corrective move is near its end. The RSI (14) though is rising and created higher high indicating that we might see higher prices. Based on this analysis, our opinion is favoring deeper correction with prices likely moving above cap at 1.2786 toward the next resistance at 1.2999. However, in the intraday the EURUSD is likely to do some sideways amid overbought Stochastic and OsMA as well as because the resistance at 1.2786 coincides with the 20 Moving Average and the 23.6% Fibonacci retracement.
Explore our
Trading Conditions
- Spreads from 0.0 pip
- 30,000+ Trading Instruments
- Stop Out Level - Only 10%
Ready to Trade?
Open Account Note:
This overview has an informative and tutorial character and is published for free. All the data, included in the overview, are received from public sources, recognized as more or less reliable. Moreover, there is no guarantee that the indicated information is full and precise. Overviews are not updated. The whole information in each overview, including opinion, indicators, charts and anything else, is provided only for familiarization purposes and is not financial advice or а recommendation. The whole text and its any part, as well as the charts cannot be considered as an offer to make a deal with any asset. IFC Markets and its employees under any circumstances are not liable for any action taken by someone else during or after reading the overview.
