- Analytics
- Technical Analysis
EUR/USD Technical Analysis - EUR/USD Trading: 2014-10-27
Euro return expectation
The main fundamental event for today is the German Ifo Business Climate release at 10:00 CET. The composite index is based on a survey conducted among manufacturers, construction companies, as well as wholesalers and retailers, calculated by German Institute for economic research Ifo. Each month a survey is run among 7000 business representatives regarding the favorable business climate and market expectations for the next six months. Note that the index is interconnected with the main macroeconomic indicators of the EU. Rapid reaction to changing business climate provides leading signals relative to possible changes of spending costs, investment funds and attracting manpower in Germany.
The index includes 2 indicators: assessment of the current economy state and evaluation of expectations. The second component has a greater importance for investors. The German economy remains the main driver for the European markets development: more than 20% of the EU GDP. This is the biggest rate among other European member states. For this reason, we expect the Ifo index to affect greatly the European currency rate.
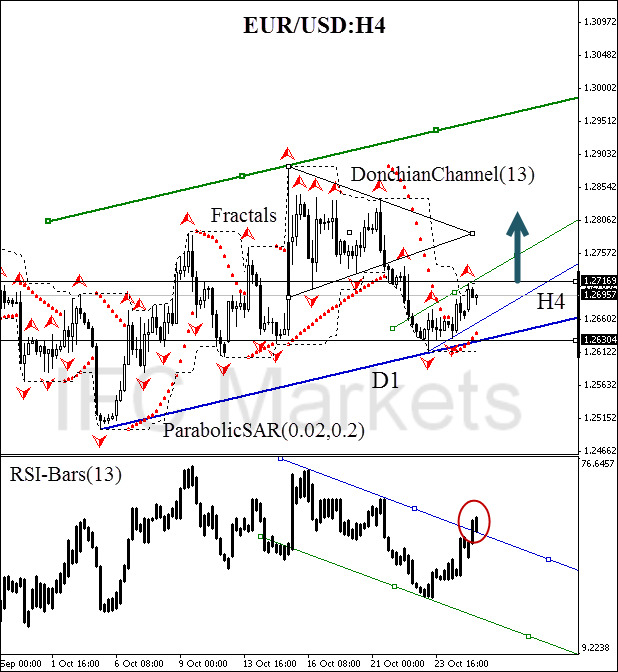
After position opening, Trailing Stop is to be moved after the Parabolic values, near the next fractal low. Updating is enough to be done every day after a new Bill Williams fractal formation (5 candlesticks). Thus, we are changing the probable profit/loss ratio to the breakeven point.
| Position | Buy |
| Buy stop | above 1.27169 |
| Stop loss | below 1.26304 |
Dear traders. You can see the detailed report of the author’s account by clicking here.
Explore our
Trading Conditions
- Spreads from 0.0 pip
- 30,000+ Trading Instruments
- Stop Out Level - Only 10%
Ready to Trade?
Open Account Note:
This overview has an informative and tutorial character and is published for free. All the data, included in the overview, are received from public sources, recognized as more or less reliable. Moreover, there is no guarantee that the indicated information is full and precise. Overviews are not updated. The whole information in each overview, including opinion, indicators, charts and anything else, is provided only for familiarization purposes and is not financial advice or а recommendation. The whole text and its any part, as well as the charts cannot be considered as an offer to make a deal with any asset. IFC Markets and its employees under any circumstances are not liable for any action taken by someone else during or after reading the overview.
