- Analytics
- Technical Analysis
EUR/USD Technical Analysis - EUR/USD Trading: 2015-03-16
Mario Draghi speaks today
Let’s examine the EUR/USD currency pair on the H4 chart. The price is moving inside the bearish trend, which is confirmed by the long-term DonchianChannel(13) bias. Currently, there is a price retracement after a long period of the euro depreciation. The market is waiting for the ECB President Mario Draghi’s speech scheduled for today at 19:45 CET.
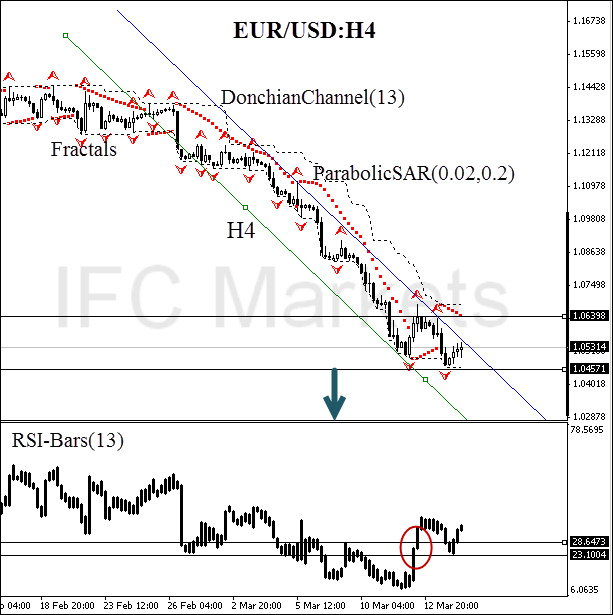
Should we take this retracement seriously? Apparently we’d better should as the oscillator signal broke the local resistance level at 28.6473% (see red ellipse on the chart), forming bullish divergence meanwhile the price kept moving downwards. However, we deem that the final price reversal is possible only after the oscillator level breakout at 23.1004%, which is confirmed by the trend line and Parabolic historical values. Oscillator bars returned to the local oversold zone. A pending sell order may be placed at 1.04571, but the price movement must fully coincide with the oscillator signal, which is more important when the price is located in the range.
Stop loss may be placed at 1.06398. This mark is confirmed by the trend line, Bill Williams fractals and the current Parabolic points. After pending order placing, Stop loss is to be moved every four hours near the next fractal high, following Parabolic signals. Thus, we are changing the probable profit/loss ratio to the breakeven point.
| Position | Sell |
| Sell stop | below 1.04571 |
| Stop loss | above 1.06398 |
- Get Certificate

Note:
This overview has an informative and tutorial character and is published for free. All the data, included in the overview, are received from public sources, recognized as more or less reliable. Moreover, there is no guarantee that the indicated information is full and precise. Overviews are not updated. The whole information in each overview, including opinion, indicators, charts and anything else, is provided only for familiarization purposes and is not financial advice or а recommendation. The whole text and its any part, as well as the charts cannot be considered as an offer to make a deal with any asset. IFC Markets and its employees under any circumstances are not liable for any action taken by someone else during or after reading the overview.
