- Analytics
- Technical Analysis
EUR/USD Technical Analysis - EUR/USD Trading: 2016-01-21
ECB meeting today
The US December inflation data were released on Wednesday. The prices edged up 0.7% year over year within 12 months hitting a new record high in a year. The core inflation (ex. Food and energy) rose up to 2.1% which is the highest since July 2012. In November it was 2%. Investors considered the US consumer prices growth as negative news for the further rates hike in the US. As a result, the US dollar slightly weakened. Today we are looking into the matter of EURUSD rate. Will it exit the sideways trend?
US inflation growth was a negative factor for dollar. Now the next significant news will be the results of the Fed meeting on January 27. No rates change is expected. However, markets hope the watchdog will disclose its monetary plans for this year. In EU the following ECB meeting is due on January 21 at 13-45 СЕТ. No rates change is expected as well. Investors are awaiting the comments on the further monetary policy and the QE program parameters. The monthly bond purchases of the Bank amount to 60 bn euros since March 2015 with its aim to stimulate the faltering European economy. For the purpose ECB has cut the deposit rate to -0.3% from -0.2%. The QE program is assumed to last till March 2017 or until the core inflation hits the target level of 2%. In December it was 0.9% year over year while the consumer price index (CPI) increased 0.2%. The next preliminary inflation data for January will come out on January 29. Lets consider the scenario of the ending sideways market for euro.
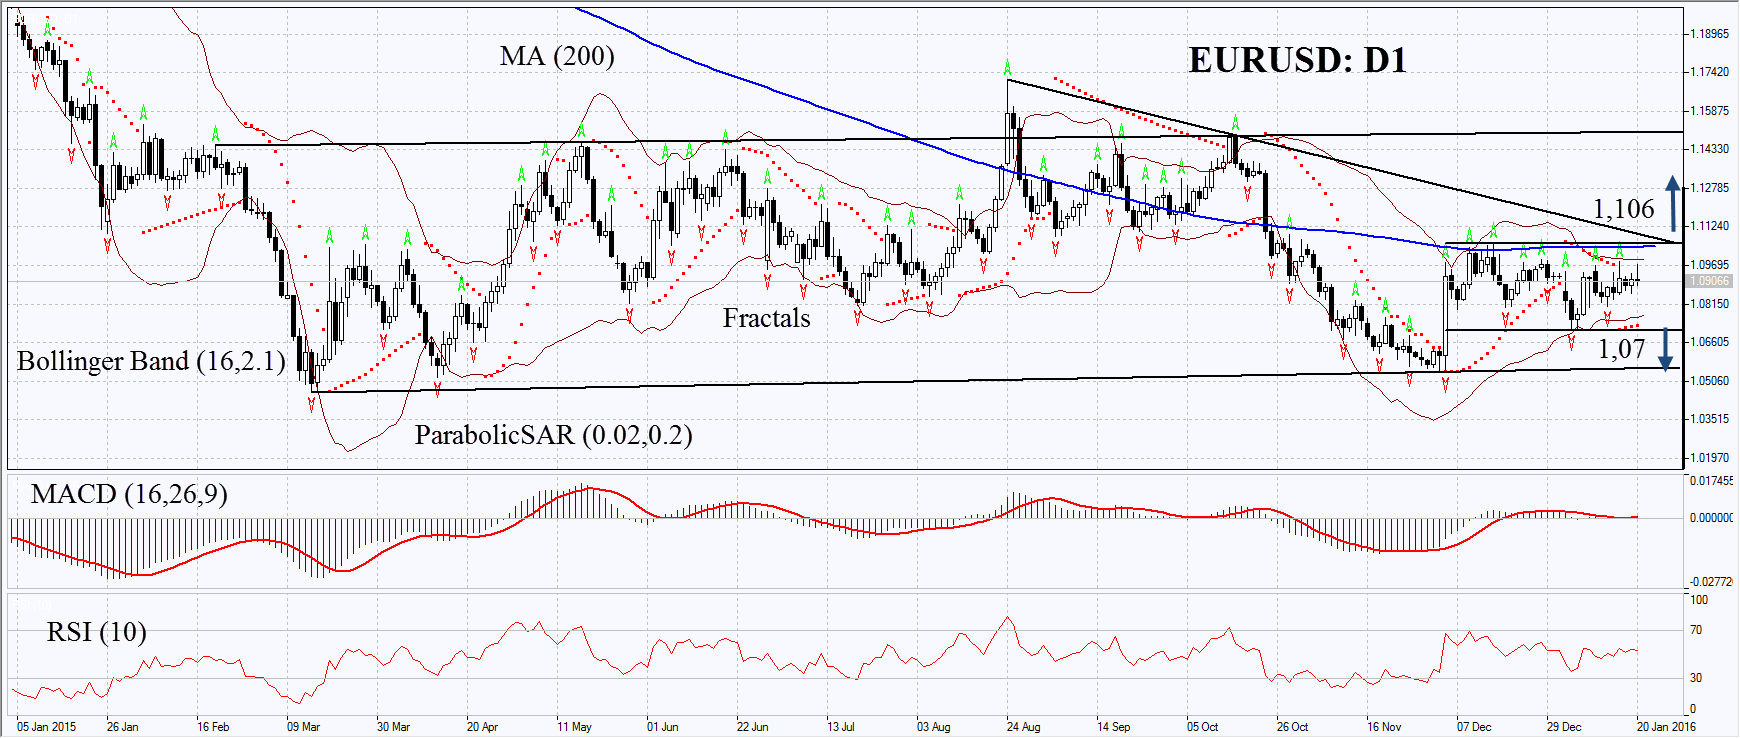
On the daily chart EURUSD:D1 is moving sideways almost since the start of 2015. Now it has verged its middle and the 200-day moving average and is hovering in a narrow range almost for 2 months. The Parabolic indicator has formed the signal to buy. MACD does not give signals due to the too small histogram bars. RSI is neutral and above 50. It has not yet reached the overbought zone, no divergence is seen. The Bollinger bands have contracted a lot which may mean much lower volatility. We believe the momentum may develop in case the chart goes up and surpasses the resistance of the neutral trend, Bollinger band and the 200-day moving average at 1.106 or, in case of the fall below the support of the neutral channel and the Parabolic signal at 1.07. The market will choose the direction itself. Two or more positions may be opened symmetrically: having opened one of the orders the second may be cancelled as the market has chosen the direction. Having opened the pending order we shall move the stop to the next fractal high (short position) and fractal low (long position) following the Parabolic signal every 4 hours. The most risk-averse traders may switch to the 4-hour chart after the trade and place there a stop-loss moving it in the direction of the trade. Thus, we are changing the probable profit/loss ratio to the breakeven point. If the price meets the stop-loss level without reaching the order, we recommend cancelling the position: the market sustains internal changes which were not taken into account.
| Position | Sell |
| Sell stop | below 1.07 |
| Stop loss | above 1.106 |
| Position | Buy |
| Buy stop | above 1.106 |
| Stop loss | below 1.07 |
- Get Certificate

Note:
This overview has an informative and tutorial character and is published for free. All the data, included in the overview, are received from public sources, recognized as more or less reliable. Moreover, there is no guarantee that the indicated information is full and precise. Overviews are not updated. The whole information in each overview, including opinion, indicators, charts and anything else, is provided only for familiarization purposes and is not financial advice or а recommendation. The whole text and its any part, as well as the charts cannot be considered as an offer to make a deal with any asset. IFC Markets and its employees under any circumstances are not liable for any action taken by someone else during or after reading the overview.
