- Analytics
- Technical Analysis
EUR/USD Technical Analysis - EUR/USD Trading: 2016-12-05
Referendum in Italy and elections in Austria may affect euro rate
Getting ready to results of constitutional referendum in Italy and presidential elections in Austria. Both events took place on December 4, 2016. On Friday national bonds of both countries were in demand which shortened the gap between their yields compared to more reliable German bonds. Some investors could have covered shorts expecting Italian referendum not to cause European split. Will euro advance?
The gap in yields of 10-year Italian and German bonds reached the 2-1/2-year high of 188 points last week. This highlights high risks of referendum in Italy. The gap fell to 167 points on Friday. The gap between Austrian and German bond yields also fell which means lowered political risks. Presidential elections in Austria may have a moderately negative effect on euro rate in case Norbert Hofer of the Freedom Party of Austria wins who criticizes the country’s membership in EU. The outcome of referendum in Italy may be weigh more on single currency. Prime-minister Matteo Renzi suggests changing national constitution to make it easier to enact new laws. Investors worry he may question whether Italy shall remain the European Union in case of victory. In the event of Italexit, ECB is to stop buying Italian state bonds which will cause defaults of local banks that have a hard time doing already. National debt of Italy rose 40% in recent 10 years to 140% of GDP. At the same time, bad debts of Italian banks are estimated to be 360bn euros. Italian economy ranks 3rd in EU and is 9 times bigger than the Greek one so Italexit may negatively affect single currency. If people vote against constitutional changes, it may push up euro rate.
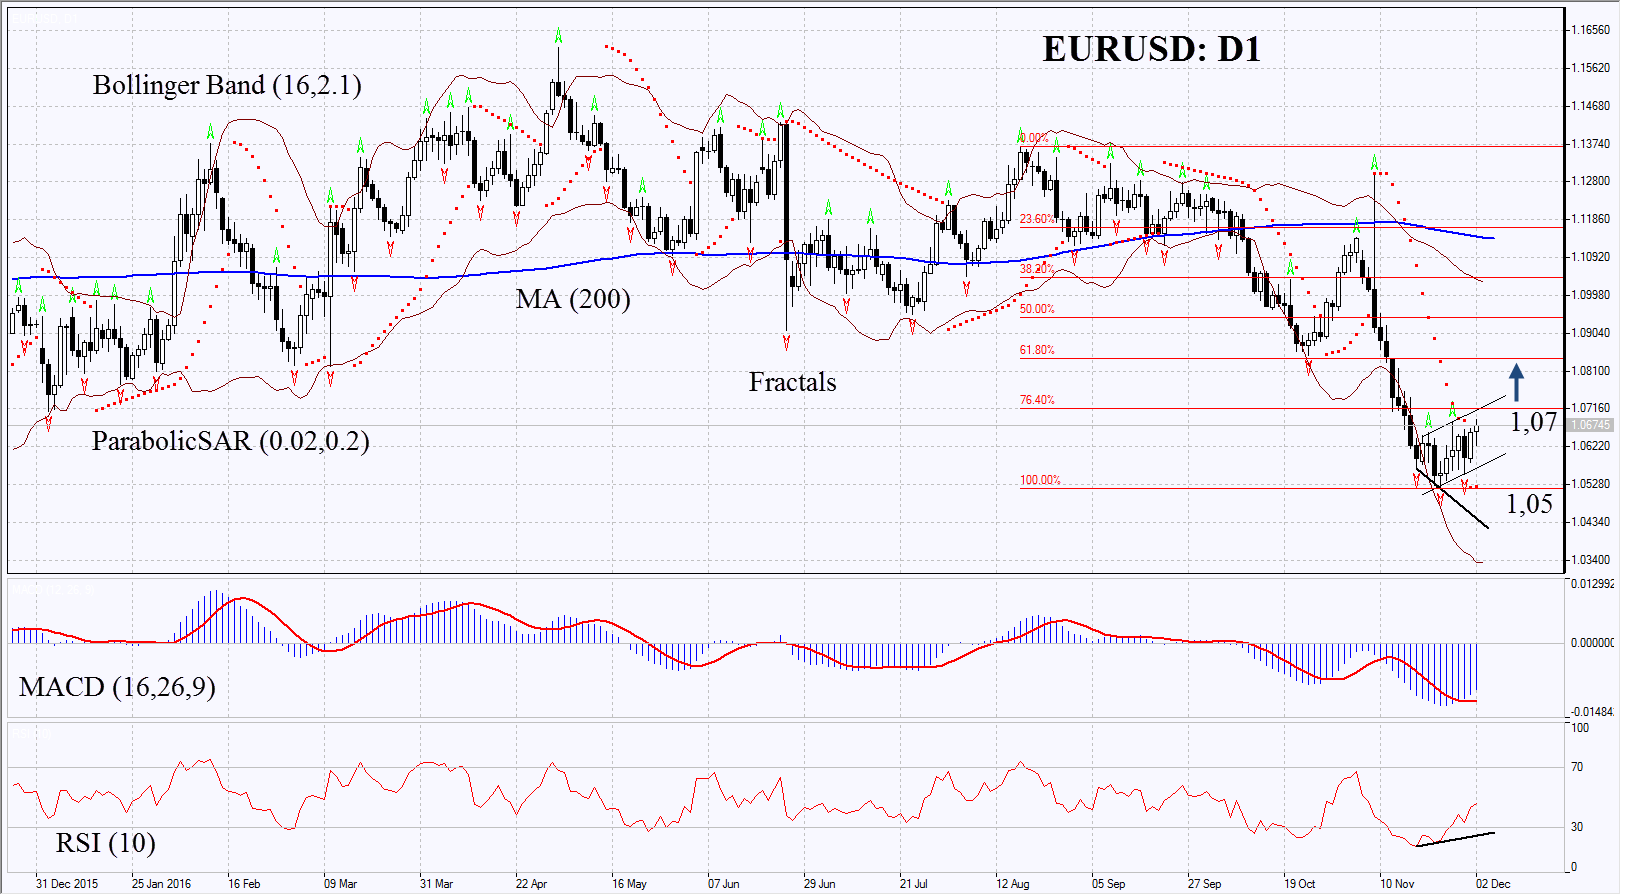
On the daily chart EURUSD: D1 is correcting up from the 8-month low. Further price increase is possible in case the candidate of the Freedom Party of Austria wins the presidential elections and in case the current constitution remains unchanged on referendum in Italy.
- Parabolic gives bullish signal.
- Bollinger bands have widened a lot which means higher volatility.
- RSI is below 50. It has formed positive divergence.
- MACD gives bullish signal.
The bullish momentum may develop in case euro surpasses two last fractal highs, 1st Fibonacci level and upper band of the rising channel at 1.07. This level may serve the point of entry. The initial stop-loss may be placed below the two last fractal lows and 8-month low, the Parabolic signal and the lower line of the rising channel at 1.05. Having opened the pending order we shall move the stop to the next fractal low following the Parabolic and Bollinger signals. Thus, we are changing the probable profit/loss ratio to the breakeven point. The most risk-averse traders may switch to the 4-hour chart after the trade and place there a stop-loss moving it in the direction of the trade. If the price meets the stop-loss level at 1.05 without reaching the order at 1.07, we recommend cancelling the position: the market sustains internal changes which were not taken into account.
Summary of technical analysis
| Position | Buy |
| Buy stop | above 1.07 |
| Stop loss | below 1.05 |
Explore our
Trading Conditions
- Spreads from 0.0 pip
- 30,000+ Trading Instruments
- Stop Out Level - Only 10%
Ready to Trade?
Open Account Note:
This overview has an informative and tutorial character and is published for free. All the data, included in the overview, are received from public sources, recognized as more or less reliable. Moreover, there is no guarantee that the indicated information is full and precise. Overviews are not updated. The whole information in each overview, including opinion, indicators, charts and anything else, is provided only for familiarization purposes and is not financial advice or а recommendation. The whole text and its any part, as well as the charts cannot be considered as an offer to make a deal with any asset. IFC Markets and its employees under any circumstances are not liable for any action taken by someone else during or after reading the overview.
