- Analytics
- Technical Analysis
FCATTLE Technical Analysis - FCATTLE Trading: 2017-03-13
“Mad cow disease” detected in Spain
World Organisation for Animal Health reported a case of “mad cow disease” in Spain. Will beef prices advance?
The infected animal was detected in northwestern region of Castilla-Leon, with no any details. European Union ranks 3rd in global beef production producing 7.6mln tonnes a year. This is about 13% of global production. At the same time, EU is net importer of beef and consumes about 150 thousand tons more than produces. The European Union accounts for 9% of global cattle number. It is hard to predict whether there is real risk that mad cow disease spreads across the European countries. But the fact is that beef prices sky-rocketed almost 50% when the disease first appeared in the US in 2003.
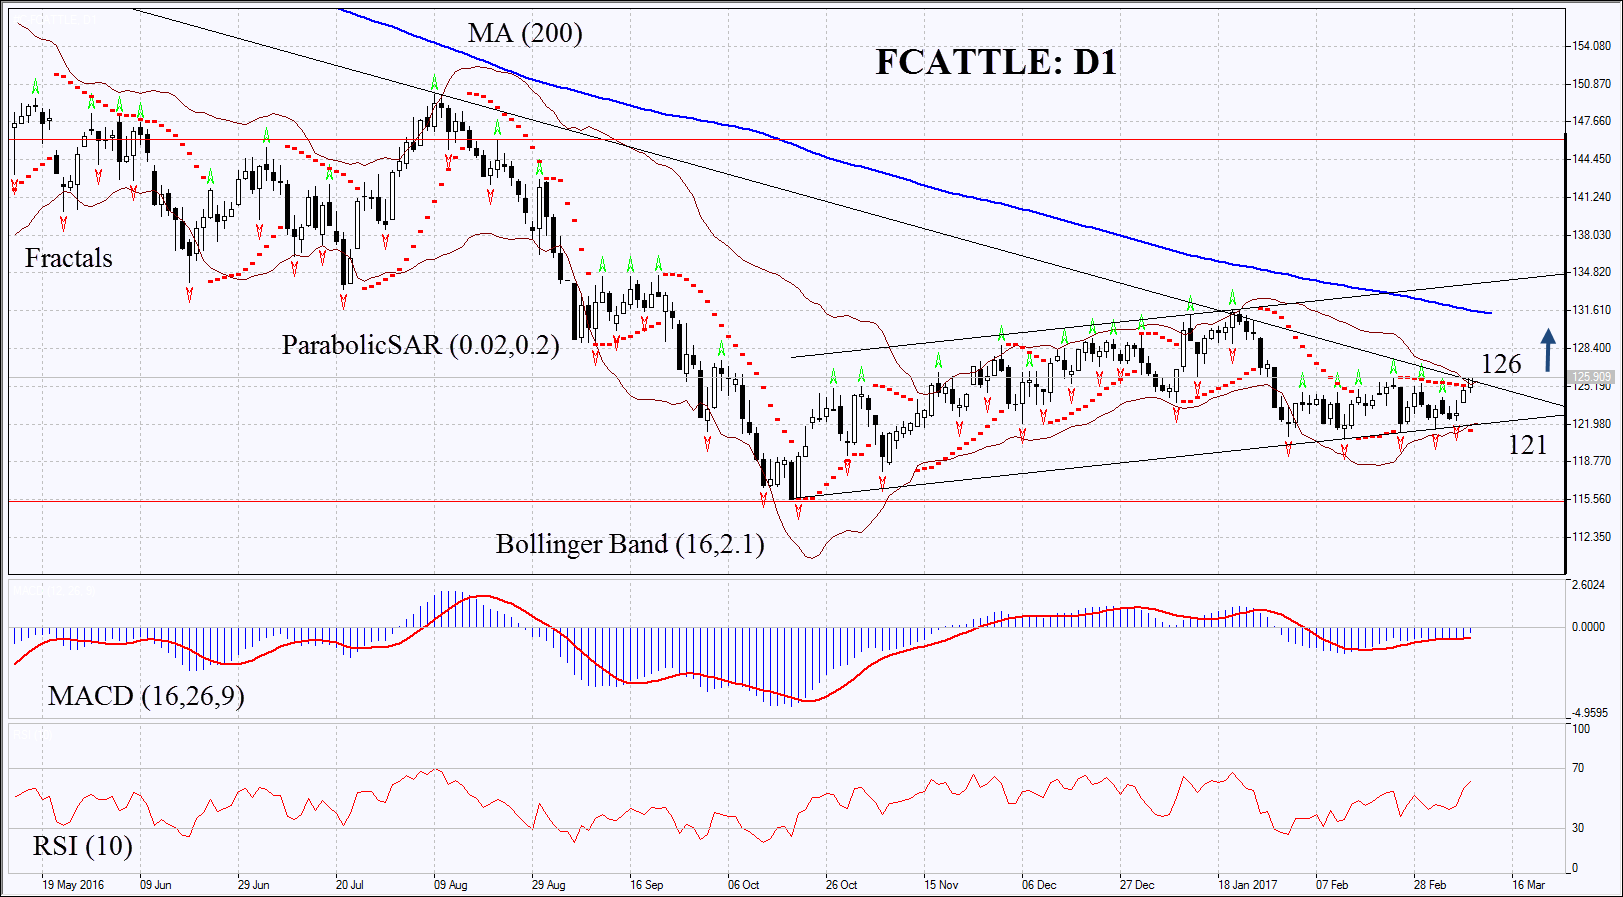
On the daily chart FCATTLE: D1 is within the rising channel. Last week it failed to break down through the support line. After that prices moved up towards the resistance line. The further increase is possible in case “mad cow disease” (or Bovine spongiform encephalopathy) spreads in the European countries.
- The Parabolic indicator gives bullish signal.
- The Bollinger bands have narrowed a lot which means extremely low volatility.
- The RSI is above 50 but haven’t yet reached the overbought zone. No divergence.
- The MACD gives bullish signals.
The bullish momentum may develop in case FCATTLE surpasses the upper Bollinger band and the three last fractal highs at 126. This level may serve the point of entry. The initial stop-loss may be placed below the three last fractal lows, the lower Bollinger band, the Parabolic signal and the upper boundary of the rising channel at 121. Having opened the pending order we shall move the stop to the next fractal low following the Parabolic and Bollinger signals. Thus, we are changing the probable profit/loss ratio to the breakeven point. The most risk-averse traders may switch to the 4-hour chart after the trade and place there a stop-loss moving it in the direction of the trade. If the price meets the stop-loss level at 121 without reaching the order at 126, we recommend cancelling the position: the market sustains internal changes which were not taken into account.
Summary of technical analysis
| Position | Buy |
| Buy stop | above 126 |
| Stop loss | below 121 |
Explore our
Trading Conditions
- Spreads from 0.0 pip
- 30,000+ Trading Instruments
- Stop Out Level - Only 10%
Ready to Trade?
Open Account Note:
This overview has an informative and tutorial character and is published for free. All the data, included in the overview, are received from public sources, recognized as more or less reliable. Moreover, there is no guarantee that the indicated information is full and precise. Overviews are not updated. The whole information in each overview, including opinion, indicators, charts and anything else, is provided only for familiarization purposes and is not financial advice or а recommendation. The whole text and its any part, as well as the charts cannot be considered as an offer to make a deal with any asset. IFC Markets and its employees under any circumstances are not liable for any action taken by someone else during or after reading the overview.
