- Analytics
- Technical Analysis
FedEx Technical Analysis - FedEx Trading: 2019-06-17
Will FedEx’s discontinuation of air delivery for Amazon drag on its stock?
FedEx decided not to continue the contract on air express delivery for Amazon packages. Will the FedEx stock price continue rebounding?
FedEx’s third quarter financial results were below expectations due to slowing global economies: the company reported earnings per share of $3.03, short of analyst estimates of $3.10. Net income fell to $797 million from $1.02 billion compared to the same quarter last year, with revenue rising from $16.5 billion to $17 billion. FedEx announced June 7 it will no longer provide air express delivery for Amazon packages in the US while continuing to serve as a carrier and last-mile delivery partner. Amazon accounted for only 1.3% of FedEx’s total revenue in 2018. FedEx stock dropped less than 1% on the news. FedEx’s next earnings report is scheduled for June 25. The company is expected to report earnings of $4.89 per share, a 17.26% year-over-year decline. However Zachs investment research company estimates FedEx will record a 3.75% increase in revenue from the year-ago period to $17.96 billion. FedEx’s stocks is currently trading at a forward price-to-earnings (P/E) ratio of 9.64. For comparison, its industry has an average forward P/E of 12.92, meaning FedEx’s stock is trading at a discount to the industry. While continuing global growth slowing is a downside risk for FedEx stock, the company is making investments to create new services and streamline in-house network of shipping and delivery services which should boost its competitiveness.
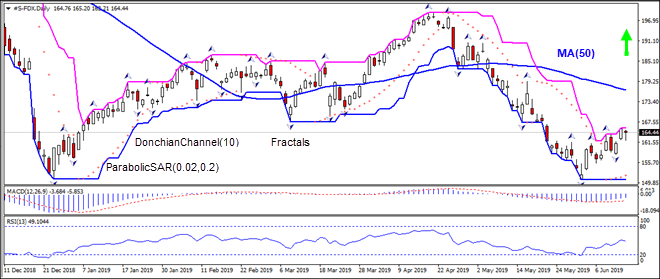
On the daily timeframe the S-FDX: D1 is retracing higher after falling to six-month low in the end of May.
- The Parabolic indicator gives a buy signal.
- The Donchian channel indicates uptrend: it has widened up.
- The MACD indicator gives a bullish signal: it is below the signal line and the gap is narrowing.
- The RSI oscillator is declining but has not reached the oversold zone yet.
We believe the bullish momentum will continue after the price breaches above the upper boundary of Donchian channel at 165.79. This level can be used as an entry point for placing a pending order to buy. The stop loss can be placed below the fractal low at 158.07. After placing the order, the stop loss is to be moved every day to the next fractal low, following Parabolic signals. Thus, we are changing the expected profit/loss ratio to the breakeven point. If the price meets the stop loss level (158.07) without reaching the order (165.79), we recommend cancelling the order: the market has undergone internal changes which were not taken into account.
Technical Analysis Summary
| Position | Buy |
| Buy stop | Above 165.79 |
| Stop loss | Below 158.07 |
Explore our
Trading Conditions
- Spreads from 0.0 pip
- 30,000+ Trading Instruments
- Stop Out Level - Only 10%
Ready to Trade?
Open Account Note:
This overview has an informative and tutorial character and is published for free. All the data, included in the overview, are received from public sources, recognized as more or less reliable. Moreover, there is no guarantee that the indicated information is full and precise. Overviews are not updated. The whole information in each overview, including opinion, indicators, charts and anything else, is provided only for familiarization purposes and is not financial advice or а recommendation. The whole text and its any part, as well as the charts cannot be considered as an offer to make a deal with any asset. IFC Markets and its employees under any circumstances are not liable for any action taken by someone else during or after reading the overview.
