- Analytics
- Technical Analysis
GB 100 Technical Analysis - GB 100 Trading: 2019-11-04
Brexit extension may reduce risks for UK companies
The British FTSE 100 index is noticeably behind the S&P 500 due to Brexit risks and looks underestimated. Will the GB100 quotations grow?
Since mid-2016, when a referendum on Britain's withdrawal from the European Union took place, the FTSE 100 grew by 15%, and the S&P 500 - by 50%. Due to this lag, the dividend yield of the British index is now 4.6% versus 2.4% for the US. The P/E (total capitalization / total profit of companies for the year) of the FTSE 100 is 14.8. This is below the P/E of the S&P 500, now equal to 21.2. The timing of Britain's exit from the EU was postponed from October 31, 2019 to January 31, 2020. This can reduce Brexit risks and help align the fundamental performance of the FTSE 100 with other global stock indices. Note that since the beginning of 2019, the S&P 500 has risen by 22%, and the FTSE 100 - by 8.5%.
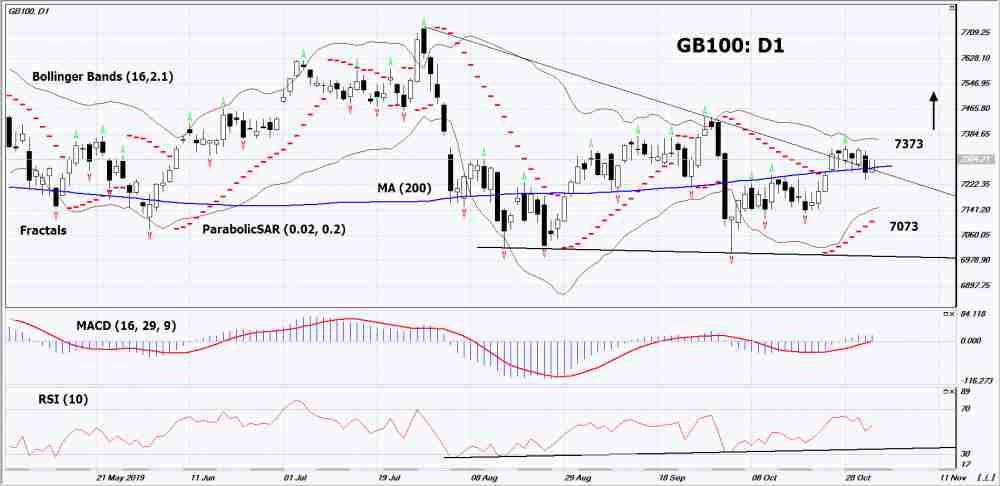
On the daily timeframeGB100: D1 is in a neutral trend around the 200-day moving average line. Various technical analysis indicators have generated signals to increase. Further growth of quotations is possible in case of successful completion of Brexit and positive economic indicators in the UK.
- The Parabolic indicator demonstrates a signal to increase.
- The Bolinger bands narrowed, indicating a volatility decrease. The bottom line of the Bollinger has a slope up.
- The RSI indicator is above the mark of 50. It has formed a divergence to increase.
- The MACD indicator gives a bullish signsl.
The bullish momentum may develop if GB100 exceeds its last upper fractal and the upper Bollinger line: 7373. This level can be used as an entry point. The initial stop lose should be placed below the last two lower fractals, the lower Bollinger line, the 200-day moving average line and the Parabolic signal: 7073. After the pending order is opened, the stop shall be moved following Bollinger and Parabolic signals to the next fractal minimum. Thus, we are changing the potential profit/loss to the breakeven point. More risk-averse traders may switch to the 4-hour chart after the trade and place a stop loss moving it in the direction of the trade. If the price meets the stop level (7073) without reaching the order (7373), we recommend to cancel the order: the market sustains internal changes that were not taken into account.
Technical Analysis Summary
| Position | Buy |
| Buy stop | Above 7373 |
| Stop loss | Below 7073 |
Explore our
Trading Conditions
- Spreads from 0.0 pip
- 30,000+ Trading Instruments
- Stop Out Level - Only 10%
Ready to Trade?
Open Account Note:
This overview has an informative and tutorial character and is published for free. All the data, included in the overview, are received from public sources, recognized as more or less reliable. Moreover, there is no guarantee that the indicated information is full and precise. Overviews are not updated. The whole information in each overview, including opinion, indicators, charts and anything else, is provided only for familiarization purposes and is not financial advice or а recommendation. The whole text and its any part, as well as the charts cannot be considered as an offer to make a deal with any asset. IFC Markets and its employees under any circumstances are not liable for any action taken by someone else during or after reading the overview.
