- Analytics
- Technical Analysis
GBP/USD Technical Analysis - GBP/USD Trading: 2018-02-23
UK growth downgrade bearish for Pound
Q4 GDP downgrade is bearish for Pound. Will the GBPUSD continue declining?
The UK economy expanded less than previously estimated in the fourth quarter: the gross domestic product rose 0.4% compared with an initial estimate of 0.5%, the Office for National Statistics said on Thursday. The slowing was due to faster price increases, which caused lower household spending. And the UK’s jobless rate increased unexpectedly for the first time in nearly two years to 4.4% in the final quarter of 2017, the ONS reported a day earlier. Brexit uncertainty still negatively impacts the outlook for the UK economy and currency. Weaker growth and labor data are bearish for Pound. On the other hand rising inflation, currently at 3%, is bullish for Pound as it increases the likelihood rate hikes.
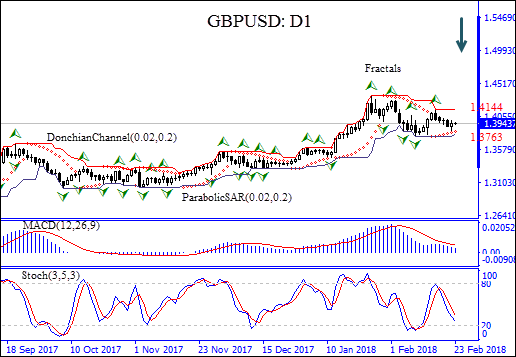
On the daily chart the GBPUSD: D1 has been retracing following the rise to 19-month high in the end of January.
- The Parabolic indicator gives a buy signal.
- The Donchian channel signals uptrend, it is tilted up.
- The MACD indicator is above the signal line and the gap is narrowing, which is a bearish signal.
- The stochastic oscillator is falling but hasn’t reached the oversold zone.
We believe the bearish movement will continue after the price breaches below the fractal low at 1.3763. A price below that level can be used as an entry point for a pending order to sell. The stop loss can be placed above the fractal high at 1.4144. After placing the pending order the stop loss is to be moved every day to the next fractal low, following Parabolic signals. Thus, we are changing the probable profit/loss ratio to the breakeven point. If the price meets the stop-loss level (1.4144) without reaching the order (1.3763) we recommend cancelling the order: the market sustains internal changes which were not taken into account.
Technical Analysis Summary
| Position | Sell |
| Sell stop | Below 1.3763 |
| Stop loss | Above 1.4144 |
Explore our
Trading Conditions
- Spreads from 0.0 pip
- 30,000+ Trading Instruments
- Stop Out Level - Only 10%
Ready to Trade?
Open Account Note:
This overview has an informative and tutorial character and is published for free. All the data, included in the overview, are received from public sources, recognized as more or less reliable. Moreover, there is no guarantee that the indicated information is full and precise. Overviews are not updated. The whole information in each overview, including opinion, indicators, charts and anything else, is provided only for familiarization purposes and is not financial advice or а recommendation. The whole text and its any part, as well as the charts cannot be considered as an offer to make a deal with any asset. IFC Markets and its employees under any circumstances are not liable for any action taken by someone else during or after reading the overview.
