- Analytics
- Technical Analysis
Grain Commodities Technical Analysis - Grain Commodities Trading: 2016-10-20
La Nina may reduce global crops
U.S. Climate Prediction Center released its September forecast where it raised the possibility of La Nina natural phenomenon this autumn to 70% and to 55% the chances it will last for the whole winter 2016/17. In previous months the chances for La Nina were around 40-45%. Will grain index advance?
La Nina causes droughts and folds which may significantly harm the global agricultural outlook. This weather phenomenon also makes the US winters colder and provokes draughts in Argentina, Brazil and other Latin-American countries. On the contrary, it may cause floods in South-Eastern Asia. In this overview we will study the chart of the &Grain_4 personal composite instrument.
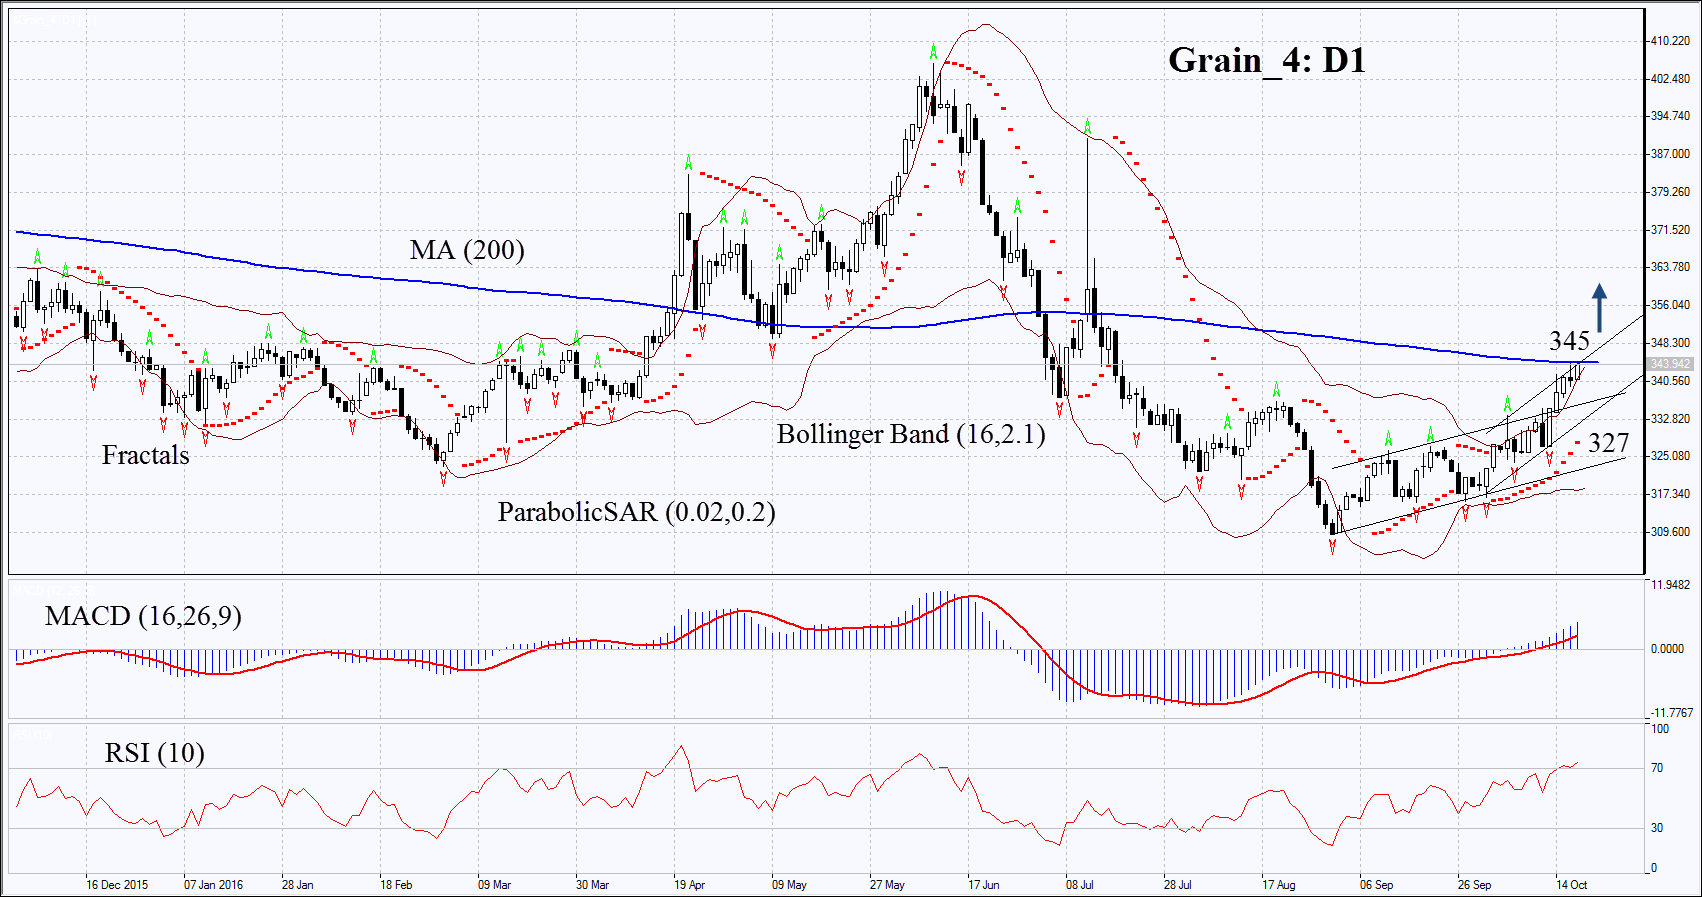
On the daily chart &Grain_4: D1 is almost twice below its high reached in mid-2012. Now it is correcting up and has approached its 200-day moving average. Its further increase in possible in case of worse weather conditions.
- Parabolic is giving bullish signals.
- Bollinger bands have widened which means higher volatility.
- RSI is in the overbought zone, no divergence.
- MACD is giving bullish signals.
The bullish momentum may develop in case Grain_4 surpasses the 200-day moving average at 345. This level may serve the point of entry. The initial stop-loss may be placed below the Parabolic signal and the last fractal low at 327. Having opened the pending order we shall move the stop to the next fractal low following the Parabolic and Bollinger signals. Thus, we are changing the probable profit/loss ratio to the breakeven point. The most risk-averse traders may switch to the 4-hour chart after the trade and place there a stop-loss moving it in the direction of the trade. If the price meets the stop-loss level at 327 without reaching the order at 345, we recommend cancelling the position: the market sustains internal changes which were not taken into account.
Summary of technical analysis
| Position | Buy |
| Buy stop | above 345 |
| Stop loss | below 327 |
Explore our
Trading Conditions
- Spreads from 0.0 pip
- 30,000+ Trading Instruments
- Stop Out Level - Only 10%
Ready to Trade?
Open Account Note:
This overview has an informative and tutorial character and is published for free. All the data, included in the overview, are received from public sources, recognized as more or less reliable. Moreover, there is no guarantee that the indicated information is full and precise. Overviews are not updated. The whole information in each overview, including opinion, indicators, charts and anything else, is provided only for familiarization purposes and is not financial advice or а recommendation. The whole text and its any part, as well as the charts cannot be considered as an offer to make a deal with any asset. IFC Markets and its employees under any circumstances are not liable for any action taken by someone else during or after reading the overview.
