- Analytics
- Technical Analysis
Hang Seng Technical Analysis - Hang Seng Trading: 2017-10-02
Preparing for the publication of statistics
On September 30, 2017 the publication of the Manufacturing PMIs by Caixin agency and the official NBS Manufacturing PMI is expected in China. A slight decrease is expected in comparison with the August indicators. Will the stock index Hang Seng decline?
Note that the Chinese markets will be closed this whole week due to the celebrations of the National Day of the People’s Republic of China. Nevertheless, it can be noted that in September Hang Seng fell for the first time this year. Theoretically, the downward correction may continue. The September decline was only 1.5%, while its growth has exceeded 25% since the beginning of this year. After the holidays in China, the foreign trade balance for September and the volume of new loans in yuan will come out, which may affect the price dynamics.
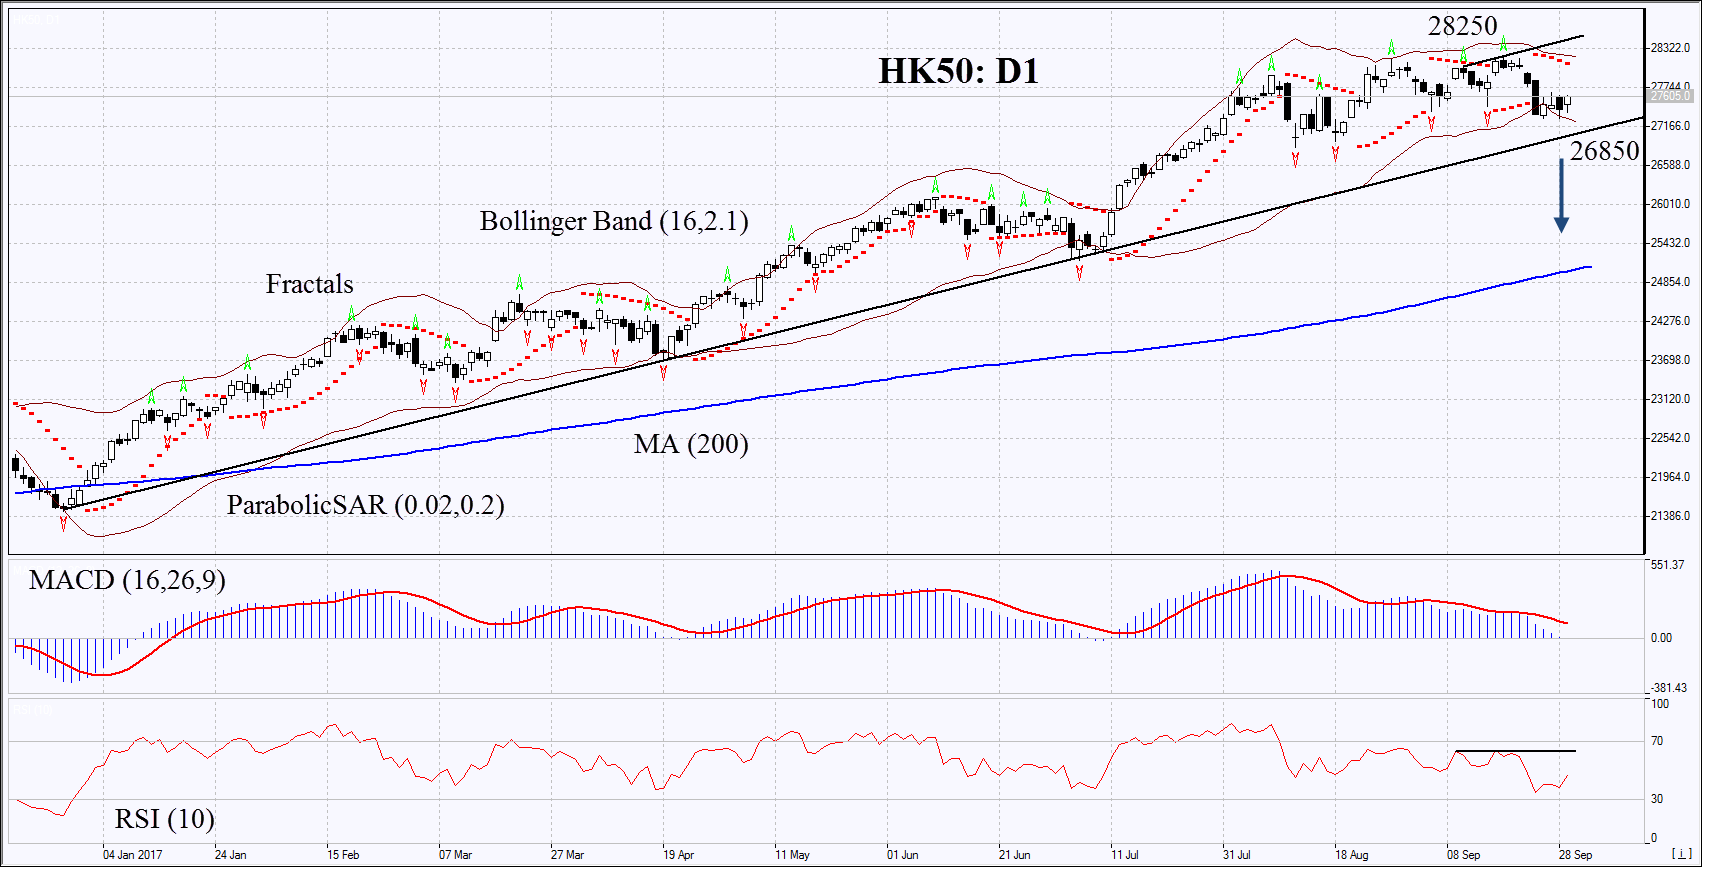
On the daily timeframe, HK50: D1 continues to be in the uptrend, but its growth has slowed down and some technical indicators formed bearish signals. Further downward correction is possible in case of the publication of weak economic and corporate data in China.
- The Parabolic indicator gives a bearish signal.
- The Bollinger bands have narrowed, which means lower volatility. They are tilted downwards.
- The RSI indicator is below 50. It has formed a negative divergence.
- The MACD indicator gives a bearish signal.
The bearish momentum may develop in case HK50 drops below the support line of the uptrend and the lower Bollinger band at 26850. This level may serve as an entry point. The initial stop loss may be placed above the 2-year high, the last fractal high, the Parabolic signal and the upper Bollinger band at 28250. After opening the pending order, we shall move the stop to the next fractal high following the Bollinger and Parabolic signals. Thus, we are changing the potential profit/loss to the breakeven point. More risk-averse traders may switch to the 4-hour chart after the trade and place there a stop loss moving it in the direction of the trade. If the price meets the stop level at 28250 without reaching the order at 26850 we recommend cancelling the position: the market sustains internal changes that were not taken into account.
Summary of technical analysis
| Position | Sell |
| Sell stop | below 26850 |
| Stop loss | above 28250 |
Explore our
Trading Conditions
- Spreads from 0.0 pip
- 30,000+ Trading Instruments
- Stop Out Level - Only 10%
Ready to Trade?
Open Account Note:
This overview has an informative and tutorial character and is published for free. All the data, included in the overview, are received from public sources, recognized as more or less reliable. Moreover, there is no guarantee that the indicated information is full and precise. Overviews are not updated. The whole information in each overview, including opinion, indicators, charts and anything else, is provided only for familiarization purposes and is not financial advice or а recommendation. The whole text and its any part, as well as the charts cannot be considered as an offer to make a deal with any asset. IFC Markets and its employees under any circumstances are not liable for any action taken by someone else during or after reading the overview.
