- Analytics
- Technical Analysis
Hang Seng Technical Analysis - Hang Seng Trading: 2019-06-11
Narrowing trade deficit bullish for HK50
Hong Kong trade deficit declined in May. Will the HK50 rebound continue?
Chinese economic data were positive recently: China’s trade balance was better than expected in May. Exports grew 1.5% in May from a year earlier when a 3.8% decline was forecast. At the same time the trade deficit in Hong Kong decreased to 35.1 billion HK dollars in April from 46.9 billion in the same month a year ago. China is Hong Kong’s top trading partner, and better than expected Chinese economic performance bodes well for Hong Kong’s economy too. And while the continuing US-China trade dispute is a downside risk for Hong Kong stock market it could prompt Beijing to step up stimulus measures before a deal is reached.
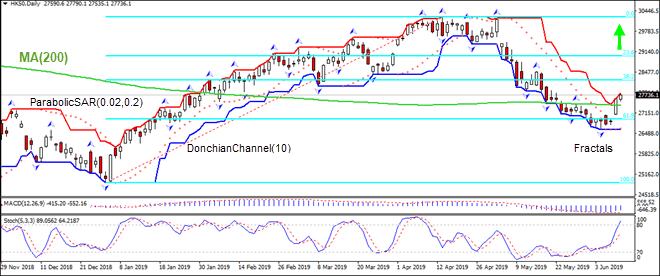
On the daily timeframe HK50: D1 has breached above the 200-day moving average MA(200). This is bullish.
- The Parabolic indicator has formed a buy signal.
- The Donchian channel indicates uptrend: it is widening up.
- The MACD indicator is below the signal line with the gap narrowing. This is a bullish signal.
- The Stochastic oscillator is rising and has breached the overbought zone, this is bearish.
We believe the bullish momentum will continue after the price breaches above the higher Donchian boundary at 27790.1. This level can be used as an entry point for placing a pending order to buy. The stop loss can be placed below the lower Donchian boundary at 26604.6. After placing the pending order the stop loss is to be moved every day to the next fractal lpw, following Parabolic signals. Thus, we are changing the expected profit/loss ratio to the breakeven point. If the price meets the stop-loss level (26604.6) without reaching the order (27790.1) we recommend cancelling the order: the market sustains internal changes which were not taken into account.
Technical Analysis Summary
| Position | Buy |
| Buy Stop | Above 27790.1 |
| Stop loss | Below 26604.6 |
Explore our
Trading Conditions
- Spreads from 0.0 pip
- 30,000+ Trading Instruments
- Stop Out Level - Only 10%
Ready to Trade?
Open Account Note:
This overview has an informative and tutorial character and is published for free. All the data, included in the overview, are received from public sources, recognized as more or less reliable. Moreover, there is no guarantee that the indicated information is full and precise. Overviews are not updated. The whole information in each overview, including opinion, indicators, charts and anything else, is provided only for familiarization purposes and is not financial advice or а recommendation. The whole text and its any part, as well as the charts cannot be considered as an offer to make a deal with any asset. IFC Markets and its employees under any circumstances are not liable for any action taken by someone else during or after reading the overview.
