- Analytics
- Technical Analysis
Cattle Futures Technical Analysis - Cattle Futures Trading: 2019-05-20
US beef exports may increase
Market participants believe that exports of beef from the United States in 2019 will be at the 2018 level. Will the LCATTLE quotations increase ?
In the first quarter of this year, exports of beef from the United States decreased by 4.7% compared to the same period in 2018. At the same time, LCATTLE quotations have fallen from the beginning of the year by 14%. Theoretically, in the time remaining to the end of the year, the export of American beef may increase. Additional positive impact may be the decision of Japan to cancel all restrictions on the supply of cattle meat from the United States. Some of them acted for more than 15 years after an outbreak of “mad cow disease” (bovine spongiform encephalopathy). The outlined growth of quotations of grain can also contribute to the rise in price of cattle, since grain is used in the production of combined feed.
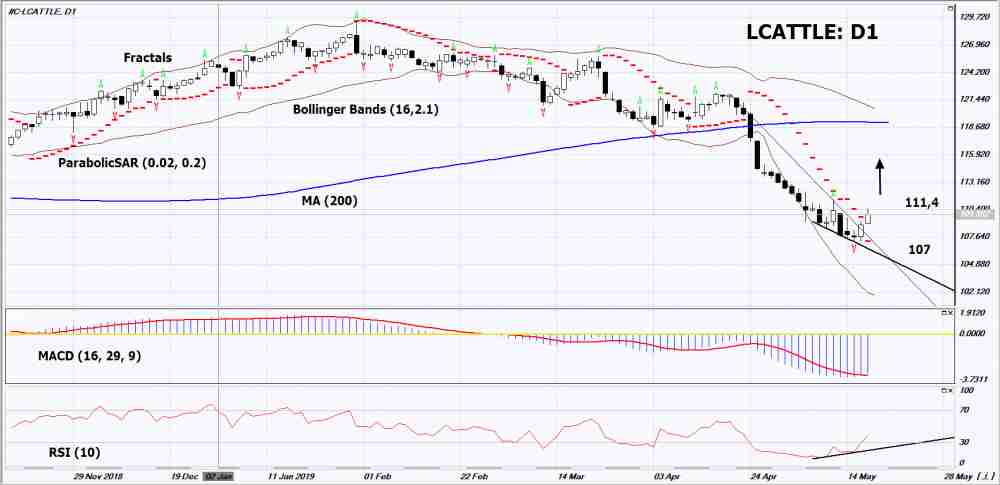
On the daily timeframe, LCATTLE: D1 is from a falling trend and is trying to adjust to the top. Various technical analysis indicators have generated upside signals. Further growth of quotations is possible in case of an increase in global demand and feed prices increase.
- The Parabolic indicator demonstrates signal to increase.
- The Bolinger-bands greatly expanded, indicating a high volatility.
- The RSI indicator is below 50. It has formed a divergence to the increase.
- The MACD indicator shows an uptrend signal .
The bullish momentum may develop if LCATTLE exceeds its last higher fractal: 111.4.This level can be used as an entry point for placing a pending order to buy. This level may serve as an entry point.The initial stop loss may be placed below the minimum from July 2018, the Parabolic signal and the last lower fractal: 107. After opening the pending order, we shall move the stop to the next fractal low following the Bollinger and Parabolic signals to the next fractal minimum. Thus, we are changing the potential profit/loss to the breakeven point. More risk-averse traders may switch to the 4-hour chart after the trade and place there a stop loss moving it in the direction of the trade. If the price meets the stop level (107) without reaching the order (111,4), we recommend to close the position: the market sustains internal changes that were not taken into account.
Technical Analysis Summary
| Position | Buy |
| Buy stop | Above 111,4 |
| Stop loss | Below107 |
Explore our
Trading Conditions
- Spreads from 0.0 pip
- 30,000+ Trading Instruments
- Stop Out Level - Only 10%
Ready to Trade?
Open Account Note:
This overview has an informative and tutorial character and is published for free. All the data, included in the overview, are received from public sources, recognized as more or less reliable. Moreover, there is no guarantee that the indicated information is full and precise. Overviews are not updated. The whole information in each overview, including opinion, indicators, charts and anything else, is provided only for familiarization purposes and is not financial advice or а recommendation. The whole text and its any part, as well as the charts cannot be considered as an offer to make a deal with any asset. IFC Markets and its employees under any circumstances are not liable for any action taken by someone else during or after reading the overview.
