- Analytics
- Technical Analysis
NZD/USD Technical Analysis - NZD/USD Trading: 2017-11-08
Preparing for the next meeting of the Reserve Bank of New Zealand
The next meeting of the Reserve Bank of New Zealand (RBNZ) is expected on November 8 2017. No rate changes are expected. Is there a possibility for the New Zealand dollar quotes to increase?
The last time the RBNZ decreased the rate in November of the last year. Currently it is at the historic low of 1.75%. This is the highest level among developed countries. The rate of the Reserve Bank of Australia is 1.5%, the Bank of Canada’s - 1% and markedly lower in other countries. With a probability of 26%, the RBNZ rate may be hiked in Q3 of 2018 and with a probability of 61% in Q1 of 2019. Over the past 10 years, the real estate in New Zealand has increased by 50%. This may prompt the RBNZ to hint at the possible timing of the rate change. The general expectations of its growth may contribute to the strengthening of the New Zealand dollar. Note that earlier its exchange rate fell on the background of escalating political risks after the Labor Party victory. Market participants feared subsequent reforms, which could require significant expenses. Meanwhile, on Tuesday, the Prime Minister of New Zealand and the leader of the Labor Party Jacinda Ardern announced that there is no need to immediately reduce migration. This could mean an easing of the reforms and could support the exchange rate of the New Zealand currency.
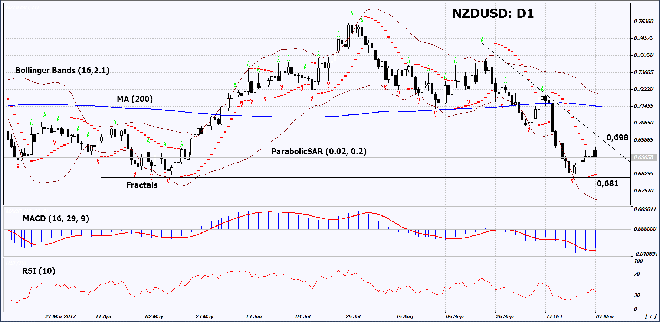
On the daily timeframe, NZDUSD: D1 is correcting upwards after updating the 5-month low. Meanwhile, the support level of the long-term neutral trend has been preserved. The further price increase is possible in case of the publication of positive economic data in New Zealand and negative data in the US.
- The Parabolic indicator gives a bullish signal.
- The Bollinger bands have widened, which means higher volatility.
- The RSI indicator is below 50. No divergence.
- The MACD indicator gives a bullish signal.
The bullish momentum may develop in case NZDUSD exceeds the resistance line of the mid-range downtrend at 0.698. This level may serve as an entry point. The initial stop loss may be placed below the last fractal low, the 5-month low and the Parabolic signal at 0.681. After opening the pending order, we shall move the stop to the next fractal low following the Bollinger and Parabolic signals. Thus, we are changing the potential profit/loss to the breakeven point. More risk-averse traders may switch to the 4-hour chart after the trade and place there a stop loss moving it in the direction of the trade. If the price meets the stop level at 0.681 without reaching the order at 0.698, we recommend cancelling the position: the market sustains internal changes that were not taken into account.
Summary of technical analysis
| Position | Buy |
| Buy stop | above 0,698 |
| Stop loss | below 0,681 |
- Get Certificate

Note:
This overview has an informative and tutorial character and is published for free. All the data, included in the overview, are received from public sources, recognized as more or less reliable. Moreover, there is no guarantee that the indicated information is full and precise. Overviews are not updated. The whole information in each overview, including opinion, indicators, charts and anything else, is provided only for familiarization purposes and is not financial advice or а recommendation. The whole text and its any part, as well as the charts cannot be considered as an offer to make a deal with any asset. IFC Markets and its employees under any circumstances are not liable for any action taken by someone else during or after reading the overview.
