- Analytics
- Technical Analysis
OATS Technical Analysis - OATS Trading: 2019-10-24
Lower output expectations bullish for oats price
USDA forecasts lower US oats production. Will the oats prices continue rising?
The US Department of Agriculture National Agricultural Statistics Service ( NASS ) Small Grains Summary projected 2019/20 oat production at 54.2 million bushels, 6.2 million below last month’s for comparable States. The decline was due both lower yield and planting projections. Average yield is estimated at 64.4 bushels per acre, down 2.0 bushels from last month’s forecast. And harvested area is projected 67,000 acres lower at 842,000 acres. Lower production is bullish for oats price.
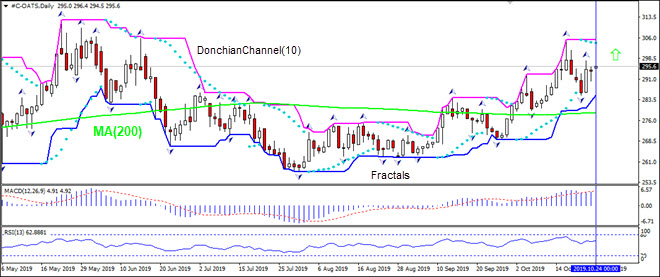
On the daily timeframe the OATS: D1 is above the 200-day moving average MA(200) which is rising .
- The Parabolic indicator gives a sell signal.
- The Donchian channel indicates uptrend: it is narrowing up.
- The MACD indicator gives a bullish signal: it is above the signal line and the gap is widening.
- The RSI oscillator is rising but has not reached the overbought zone.
We believe the bullish momentum will continue. A pending order to buy can be placed above the level 296.4. The stop loss can be placed below the lower Donchian boundary at 285.1. After placing the order, the stop loss is to be moved every day to the next fractal low, following Parabolic signals. Thus, we are changing the expected profit/loss ratio to the breakeven point. If the price meets the stop loss level (285.1) without reaching the order (296.4), we recommend cancelling the order: the market has undergone internal changes which were not taken into account.
Technical Analysis Summary
| Order | Buy |
| Buy stop | Above 296.4 |
| Stop loss | Below 285.1 |
Explore our
Trading Conditions
- Spreads from 0.0 pip
- 30,000+ Trading Instruments
- Stop Out Level - Only 10%
Ready to Trade?
Open Account Note:
This overview has an informative and tutorial character and is published for free. All the data, included in the overview, are received from public sources, recognized as more or less reliable. Moreover, there is no guarantee that the indicated information is full and precise. Overviews are not updated. The whole information in each overview, including opinion, indicators, charts and anything else, is provided only for familiarization purposes and is not financial advice or а recommendation. The whole text and its any part, as well as the charts cannot be considered as an offer to make a deal with any asset. IFC Markets and its employees under any circumstances are not liable for any action taken by someone else during or after reading the overview.
