- Analytics
- Technical Analysis
Natural Gas vs Oil Technical Analysis - Natural Gas vs Oil Trading: 2018-03-07
Oil prices are declining on the background of Donald Trump’s protectionist policy
In this review, we suggest considering the personal composite instrument (PCI) & SumOIL/GAS. It reflects the price dynamics of the futures portfolio of two oil brands - Brent and WTI against the futures on natural gas. Will SumOIL/GAS quotes drop?
Such movement means that oil prices decline faster than those of natural gas. Currently oil quotes are indeed declining amid the protectionist policy of the US President Donald Trump. Recently he signed a decree imposing prohibitive import duties on steel and aluminum to the United States. Some market participants do not exclude that oil imports may also be limited amid the increase in its production in the US and the decrease in the reserves. According to the American Petroleum Institute, the growth of the US commercial oil reserves amounted to 5.66 mln barrels in a week. This may indicate a reduction in demand. The official data on the reserves will be published on Wednesday. U.S. Energy Information Administration expects a significant increase in the US oil production to 11.17 mln barrels per day in the Q4 of 2018. In turn, at present natural gas is in high demand on the background of cold weather in the United States. Its quotes reached a high in a month. Next week market participants expect an increase in the demand for gas to 99.4 bln cubic feet per day in the US, compared with 92.8 bln last week.
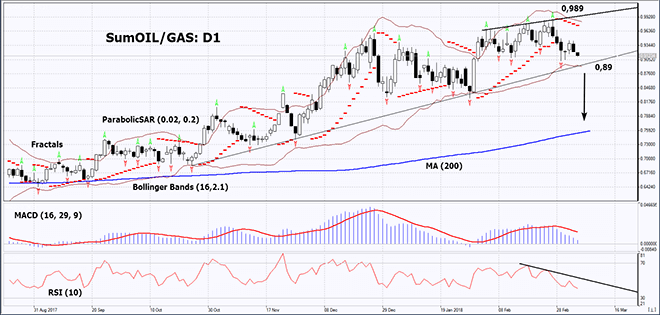
On the daily timeframe, SumOIL/GAS: D1 is approaching the support line of the rising trend. It has to be breached down to open a position. Meanwhile, the pattern is in the rising trend, but the growth has slowed down and some technical analysis indicators have formed Sell signals. The further decrease is possible in case of the publication of positive news on gas, as well as negative one on oil.
- The Parabolic indicator gives a bearish signal.
- The Bollinger bands have narrowed, which means lower volatility. They are tilted down.
- The RSI indicator is below 50. It has formed a negative divergence.
- The MACD indicator gives a bearish signal.
The bearish momentum may develop in case SumOIL/GAS drops below the last fractal low and the lower Bollinger band at 0.89. This level may serve as an entry point. The initial stop loss may be placed above the last fractal high, the historic high, the upper Bollinger band and the Parabolic signal at 0.989. After opening the pending order, we shall move the stop to the next fractal high following the Bollinger and Parabolic signals. Thus, we are changing the potential profit/loss to the breakeven point. More risk-averse traders may switch to the 4-hour chart after the trade and place there a stop loss moving it in the direction of the trade. If the price meets the stop level at 0.989 without reaching the order at 0.89, we recommend cancelling the position: the market sustains internal changes that were not taken into account.
Summary of technical analysis
| Position | Sell |
| Sell stop | below 0,89 |
| Stop loss | above 0,989 |
- Get Certificate

Note:
This overview has an informative and tutorial character and is published for free. All the data, included in the overview, are received from public sources, recognized as more or less reliable. Moreover, there is no guarantee that the indicated information is full and precise. Overviews are not updated. The whole information in each overview, including opinion, indicators, charts and anything else, is provided only for familiarization purposes and is not financial advice or а recommendation. The whole text and its any part, as well as the charts cannot be considered as an offer to make a deal with any asset. IFC Markets and its employees under any circumstances are not liable for any action taken by someone else during or after reading the overview.
