- Analytics
- Technical Analysis
Soybean Meal Technical Analysis - Soybean Meal Trading: 2017-07-04
Drought in the USA may harm crops
The cost of grain crops has risen sharply against the background of hot weather and drought in the US and European countries, as well as because of the worsening of weather conditions and floods in Brazil and Argentina. Will soybean meal prices rise?
It is derived from the production of soybean oil and is used as a high-protein additive in combined feeds for farm animals. Soybean meal prices, as a rule, strongly correlate with the cost of soybeans. Note that according to the Commodity Futures Trading Commission, hedge funds increased the volume of short positions on soy last week. Their closure may give an additional impulse to the growth of quotations. On Tuesday, the US Stock exchanges do not work due to the holiday – Independence Day in the US. On Wednesday evening, at 21:00 CET, the monthly review of crops for May by the US Department of Agriculture will come out. It may have a strong impact on soy and soybean meal prices.
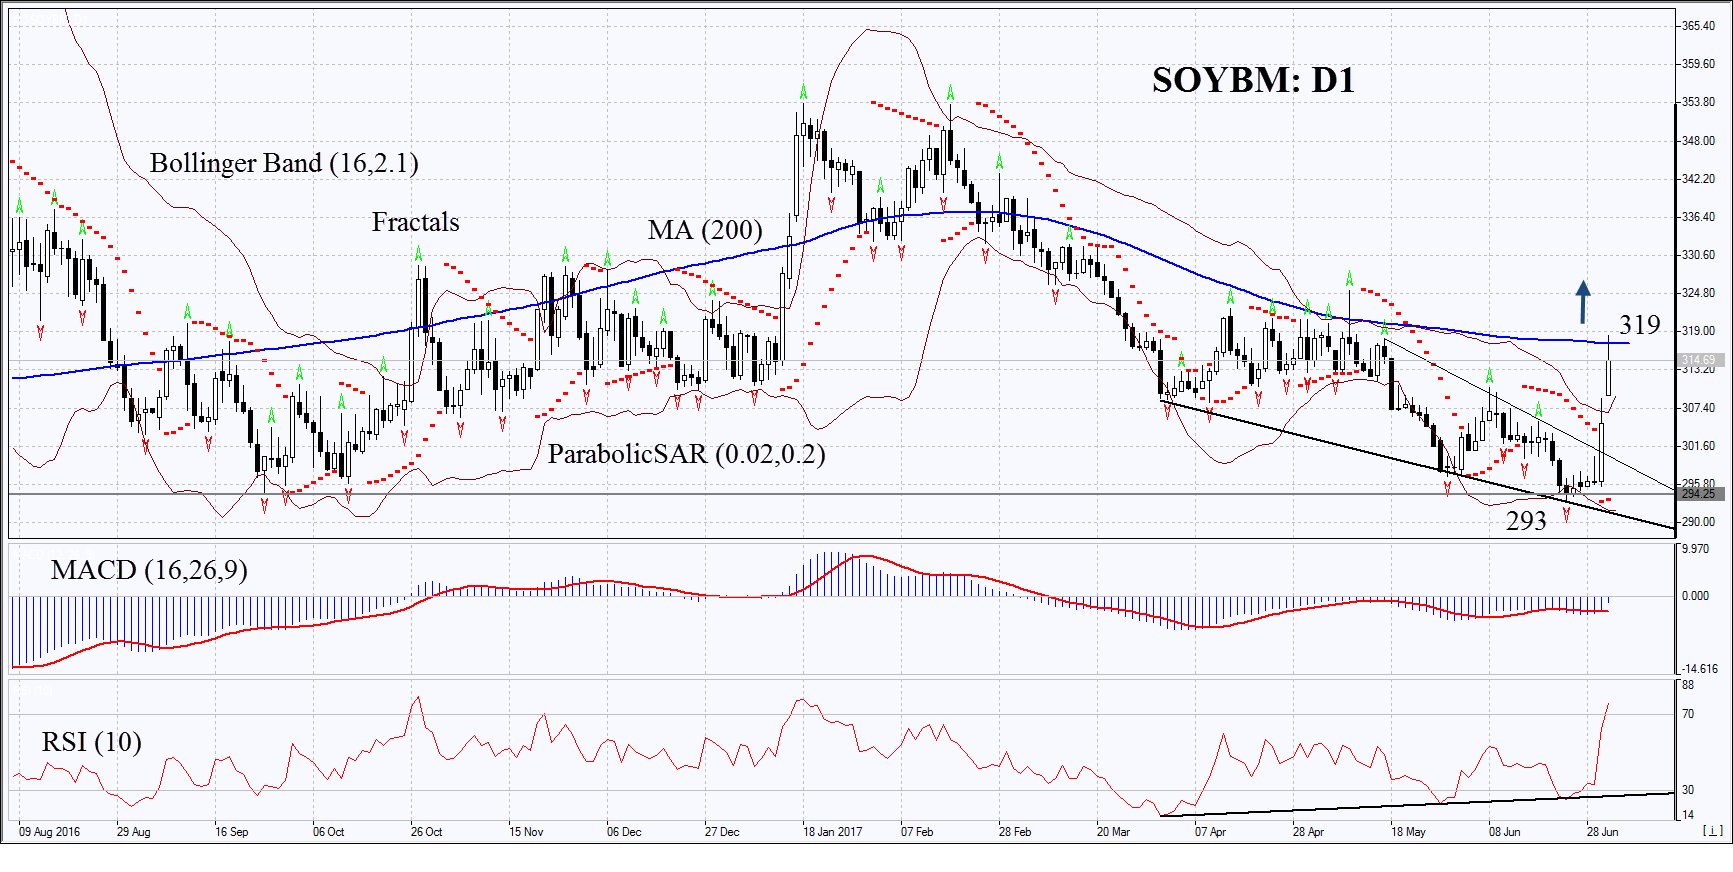
On the daily timeframe, SOYBM: D1 has exited the downtrend and turned upward. The further price increase is possible in case of a decline in soybean crops in the USA and Latin America.
- The Parabolic indicator is giving a bullish signal.
- The Bollinger bands have narrowed, which indicates low volatility. They are titled upward.
- The RSI indicator reached the overbought zone. It has formed a positive divergence.
- The MACD indicator is giving a bullish signal.
The bullish momentum may develop in case SOYBM exceeds the 200-day moving average line and the last fractal high at 319. This level may serve as an entry point. The initial stop-loss may be placed below the last fractal low and the Parabolic signal at 293. After opening the pending order, we shall move the stop to the next fractal low following the Bollinger and Parabolic signals. Thus, we are changing the potential profit/loss to the breakeven point. More risk-averse traders may switch to the 4-hour chart after the trade and place there a stop-loss moving it in the direction of the trade. If the price meets the stop level 293 without reaching the order at 319, we recommend cancelling the position: the market sustains internal changes that were not taken into account.
Summary of technical analysis
| Position | Buy |
| Buy stop | Above 319 |
| Stop loss | Below 293 |
Explore our
Trading Conditions
- Spreads from 0.0 pip
- 30,000+ Trading Instruments
- Stop Out Level - Only 10%
Ready to Trade?
Open Account Note:
This overview has an informative and tutorial character and is published for free. All the data, included in the overview, are received from public sources, recognized as more or less reliable. Moreover, there is no guarantee that the indicated information is full and precise. Overviews are not updated. The whole information in each overview, including opinion, indicators, charts and anything else, is provided only for familiarization purposes and is not financial advice or а recommendation. The whole text and its any part, as well as the charts cannot be considered as an offer to make a deal with any asset. IFC Markets and its employees under any circumstances are not liable for any action taken by someone else during or after reading the overview.
