- Analytics
- Technical Analysis
S&P 500 Technical Analysis - S&P 500 Trading: 2019-06-21
Positive data and dovish Fed bullish for SP500
Federal Reserve indicated it would act to support expansion with data pointing to continued strength of US economy. Will the SP500 stock index continue advancing?
US monetary authority indicated a leaning toward easier policy at June 17-18 policy meeting. While the Federal Reserve left federal funds rates unchanged in 2.25%-2.5% range, chairman Powell said the central bank would “act as appropriate to sustain the expansion”. US economic data were positive on balance ahead of the Federal Reserve meeting: US retail sales grew 0.5% in May, industrial production rose 0.4% when 0.2% rise was expected, and utilization edged up 0.2 percentage point to 78.1%. And while housing starts declined 0.9% on month in May, building permits rose 0.3% after 0.2% increase in April. With the Federal Reserve vowing to take measures if expansion is jeopardized in case of prolonged US-China tariff standoff positive economic data are bullish for US equities market.
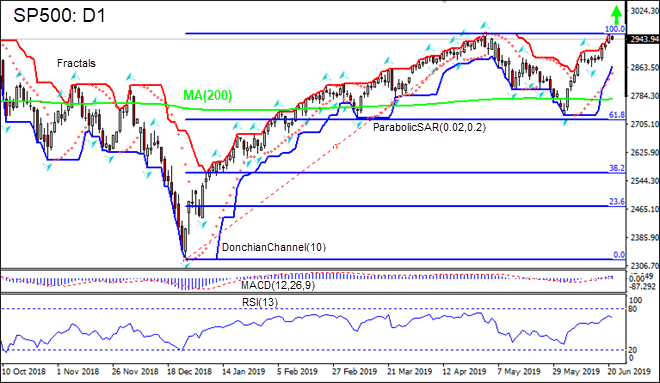
On the daily timeframe SP500: D1 is rising since failure to close below Fibonacci 61.8 level. It has returned above 200-day moving average MA(200). These are bullish developments.
- The Donchian channel indicates uptrend: it is tilted up.
- The Parabolic indicator has formed a buy signal.
- The MACD indicator is above the signal line and the gap is widening, which is a bullish signal.
- The RSI oscillator is rising but has not reached the overbought zone.
We believe the bullish momentum will continue as the price breaches above the upper boundary of Donchian channel at 2959.22. This level can be used as an entry point for placing a pending order to buy. The stop loss can be placed below the lower Donchian boundary at 2866.47. After placing the order, the stop loss is to be moved every day to the next fractal low, following Parabolic signals. Thus, we are changing the expected profit/loss ratio to the breakeven point. If the price meets the stop loss level (2866.47) without reaching the order (2959.22), we recommend cancelling the order: the market has undergone internal changes which were not taken into account.
Technical Analysis Summary
| Order | Buy |
| Buy stop | Above 2959.22 |
| Stop loss | Below 2866.47 |
Explore our
Trading Conditions
- Spreads from 0.0 pip
- 30,000+ Trading Instruments
- Stop Out Level - Only 10%
Ready to Trade?
Open Account Note:
This overview has an informative and tutorial character and is published for free. All the data, included in the overview, are received from public sources, recognized as more or less reliable. Moreover, there is no guarantee that the indicated information is full and precise. Overviews are not updated. The whole information in each overview, including opinion, indicators, charts and anything else, is provided only for familiarization purposes and is not financial advice or а recommendation. The whole text and its any part, as well as the charts cannot be considered as an offer to make a deal with any asset. IFC Markets and its employees under any circumstances are not liable for any action taken by someone else during or after reading the overview.
