- Analytics
- Technical Analysis
USD/CAD Technical Analysis - USD/CAD Trading: 2018-03-08
US import tariffs bullish for USDCAD
Recent Canadian mixed data and US metals import tariffs weigh on Canadian dollar. Will the USDCAD continue recent climb?
Bank of Canada left its benchmark interest rate unchanged at 1.25% during its policy meeting on Wednesday. Recent economic data were mixed: January trade deficit narrowed while the Canadian GDP expanded at 1.7% annual rate in fourth quarter, higher than the 1.5% in Q3 but below expectations of a 2% growth. President Trump’s plans to impose tariffs on steel and aluminum imports negatively impacted Canadian dollar: Canada is the largest exporter of such metals to the US. And while Trump tweeted tariffs may not affect Canada and Mexico if new, “fairer” North American Free Trade Agreement is concluded the negotiations may drag out far longer than expected.
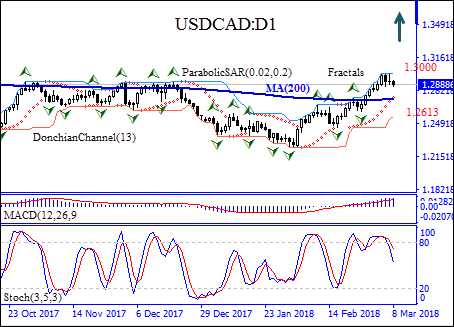
USDCAD: D1 has been rising on the daily timeframe since it hit a six-month low in the beginning of February. The price is above the 200-day moving average MA(200).
- Parabolic indicator gives a buy signal.
- The Donchian channel indicates no trend yet: it is flat.
- The MACD indicator is above the signal line and the gap is widening, this is bullish.
- The Stochastic oscillator is falling but has not reached the oversold zone.
We expect the bullish momentum will continue after the price closes above the upper bound of the Donchian channel at 1.30. A price point above that level can be used as an entry point for a pending order to buy. The stop loss can be placed below the fractal low at 1.2613. After placing the pending order the stop loss is to be moved to the next fractal low following Parabolic signals. Thus, we are changing the profit/loss ratio to the breakeven point. If the price meets the stop loss level (1.2613) without reaching the order (1.30), we recommend cancelling the order: the market sustains internal changes which were not taken into account.
Technical Analysis Summary
| Position | Buy |
| Buy stop | Above 1.30 |
| Stop loss | Below 1.2613 |
Explore our
Trading Conditions
- Spreads from 0.0 pip
- 30,000+ Trading Instruments
- Stop Out Level - Only 10%
Ready to Trade?
Open Account Note:
This overview has an informative and tutorial character and is published for free. All the data, included in the overview, are received from public sources, recognized as more or less reliable. Moreover, there is no guarantee that the indicated information is full and precise. Overviews are not updated. The whole information in each overview, including opinion, indicators, charts and anything else, is provided only for familiarization purposes and is not financial advice or а recommendation. The whole text and its any part, as well as the charts cannot be considered as an offer to make a deal with any asset. IFC Markets and its employees under any circumstances are not liable for any action taken by someone else during or after reading the overview.
