- Analytics
- Technical Analysis
USD/CHF Technical Analysis - USD/CHF Trading: 2016-07-11
Rates divergence affects exchange rate
US dollar hit a fresh 5-week high against the Swiss franc on Friday on strong US labour market data for June. The US Non-farm Payrolls were the highest since last October having surpassed by far all expectations and totaling 287 thousand. Will USDCHF continue rising?
The data may rekindle hopes on Fed rate hike till the end of this year. The CME Group Fed funds futures price in 23% chance of the December hike, up from 19% before the data. The adjusted unemployment came out in Switzerland on Friday, it is unchanged at 3.3%. In our opinion, the core negative factor for the Swiss franc is deflation which is recorded since autumn 2014. This may cause further easing of the monetary policy by the National Swiss Bank. Its current interest rate is -0.75% while the 10-year bond yields are -0.61% a year. The Fed rate is currently 0.375% and the 10-year Treasury yield is 1.38% a year. Such a noticeable divergence in rates may USDCHF higher. The further significant data will come out in Switzerland on June 21: trade balance for June.
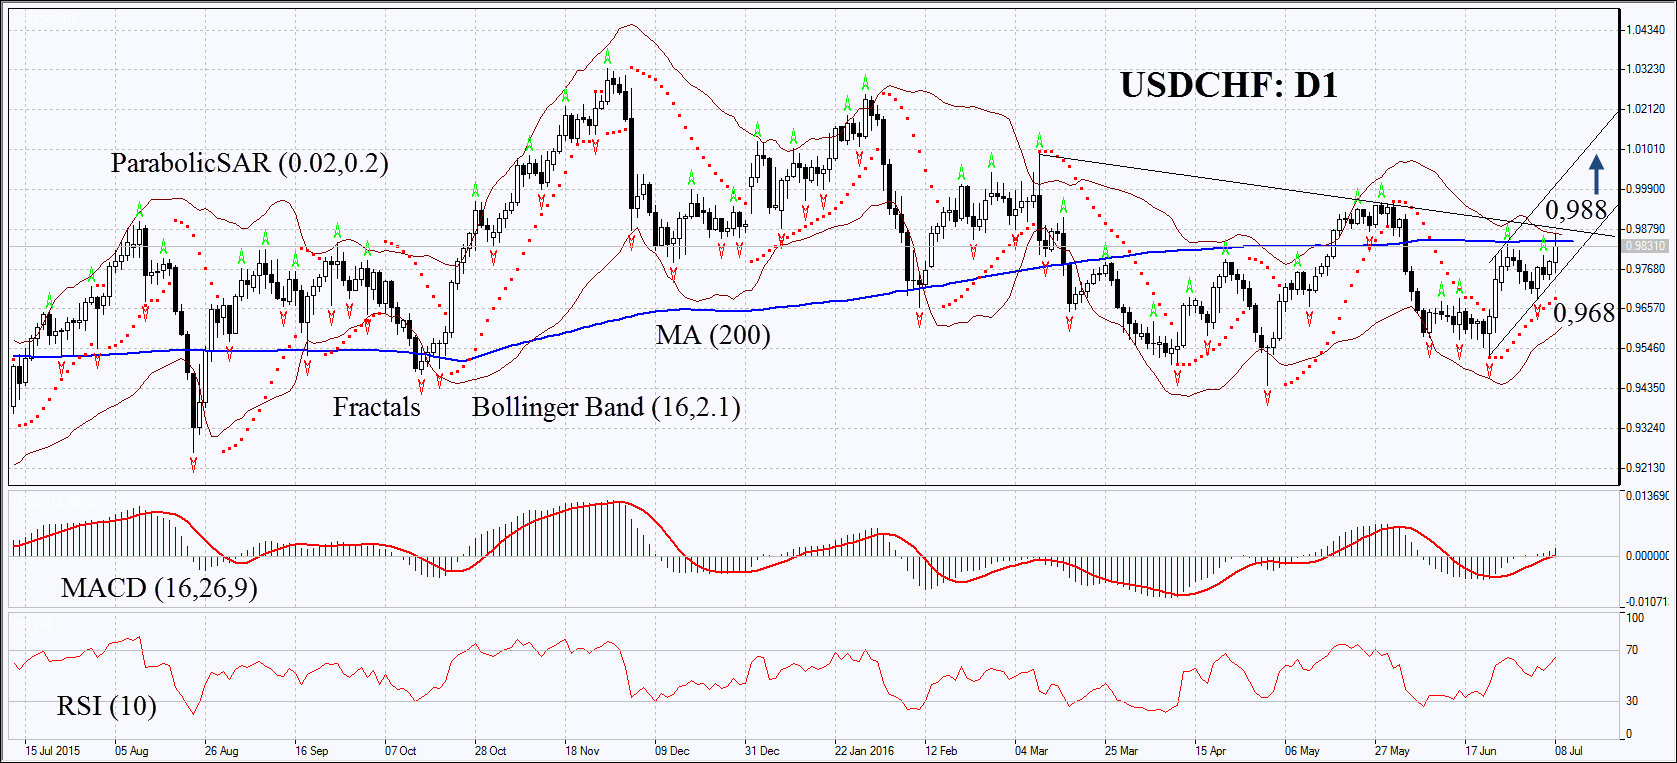
On the daily chart USDCHF: D1 has approached resistance of mid-term downtrend and 200-day moving average. The MACD and Parabolic indicators give signals to buy. The Bollinger bands have contracted a lot which means lower volatility. RSI is above 50 and has not yet reached the overbought zone, no divergence. The bullish momentum may develop in case the Swiss franc surpasses the two last fractal highs, 200-day moving average, support of the downtrend and Bollinger band at 0.988. This level may serve the point of entry. The initial risk limit may be placed below the last fractal low, the Parabolic signal and the support of the rising trend at 0.968. Having opened the pending order we shall move the stop to the next fractal low following the Parabolic and Bollinger signals. Thus, we are changing the probable profit/loss ratio to the breakeven point. The most risk-averse traders may switch to the 4-hour chart after the trade and place there a stop-loss moving it in the direction of the trade. If the price meets the stop-loss level at 0.968 without reaching the order at 0.988, we recommend cancelling the position: the market sustains internal changes which were not taken into account.
| Position | Buy |
| Buy stop | above 0.988 |
| Stop loss | below 0.968 |
- Get Certificate

Note:
This overview has an informative and tutorial character and is published for free. All the data, included in the overview, are received from public sources, recognized as more or less reliable. Moreover, there is no guarantee that the indicated information is full and precise. Overviews are not updated. The whole information in each overview, including opinion, indicators, charts and anything else, is provided only for familiarization purposes and is not financial advice or а recommendation. The whole text and its any part, as well as the charts cannot be considered as an offer to make a deal with any asset. IFC Markets and its employees under any circumstances are not liable for any action taken by someone else during or after reading the overview.
