- Analytics
- Technical Analysis
USD/JPY Technical Analysis - USD/JPY Trading: 2015-06-23
Escaping triangle
Let us consider the USD/JPY currency pair on the H4 time frame. The price is consolidated within the descending triangle, which lower boundary is more than thrice confirmed by Bill Williams fractals. This is the most substantial support line on the current time frame. The triple bottom pattern allows placing a long position if additional conditions are met. It is worth mentioning that the RSI-Bars oscillator has already shaped a trend channel with a positive slope. The bullish divergence assures our assumptions.
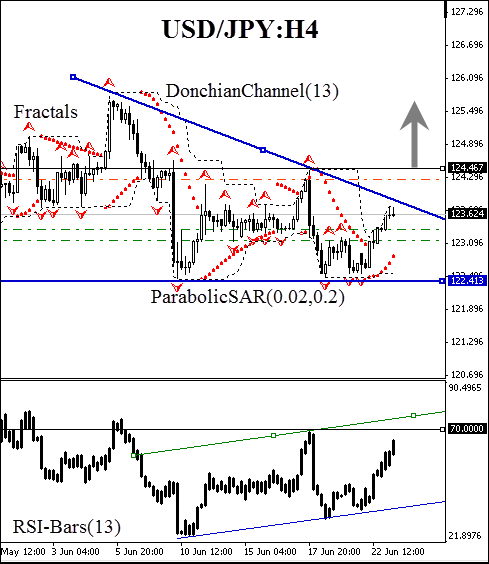
We suppose that all the represented analysis tools have been giving bullish signals. The Parabolic and Donchian indicators confirm the market direction. The terminal impulse is expected after breaching the triangle and crossing the fractal support at 124.467, which is confirmed by the fractal and Donchian Channel historical values. A buy pending order may be placed at this mark. A stop loss may be placed at the channel opposite boundary at 122.413. The bullish momentum may also be confirmed by breaking out the oscillator support at 70%. Conservative traders are recommended to monitor this signal. The stop loss is supposed to be moved every four hours near the next fractal low, following the Parabolic indicator. Thus, we are changing the probable profit/loss ratio to the breakeven point.
| Position | buy |
| Buy stop | above 124.467 |
| Stop loss | below 122.413 |
- Get Certificate

Note:
This overview has an informative and tutorial character and is published for free. All the data, included in the overview, are received from public sources, recognized as more or less reliable. Moreover, there is no guarantee that the indicated information is full and precise. Overviews are not updated. The whole information in each overview, including opinion, indicators, charts and anything else, is provided only for familiarization purposes and is not financial advice or а recommendation. The whole text and its any part, as well as the charts cannot be considered as an offer to make a deal with any asset. IFC Markets and its employees under any circumstances are not liable for any action taken by someone else during or after reading the overview.
