- Analytics
- Technical Analysis
USD/JPY Technical Analysis - USD/JPY Trading: 2016-12-14
Awaiting Fed decision
On Wednesday, December 14, 2016 the Fed meeting will take place. With almost 100% chances interest rate will be hiked by 0.25p.p. Will the common traders’ saying "buy rumors — sell facts" work out? How will yen act?
Due to expected rate hike, US dollar index advanced almost 10% since this May. In theory, it may correct down. In this review we will consider the chances for Japanese yen to get stronger against the US dollar as more technical signals are seen in USDJPY chart. We believe the yen weakened as new US President Donald Trump said the he will pull US out of the Trans-Pacific Partnership (TPP). Japan is one of its members. It is hard to predict yet how the US withdrawal from TPP may affect its economy. We assume that Japan will anyway be the major ally of the US in the region. The main positive factor is the decision of the Bank of Japan to keep the asset-buying program of 80trn yen a month till Q2 2017. The next BoJ meeting will take place on December 20, 2016. No rate change is expected. On Wednesday morning, December 14, the Tankan economic indicators for Q4 will come out. They are expected to reach the record high since 2015 which may support the yen. It looks as decline in the chart.
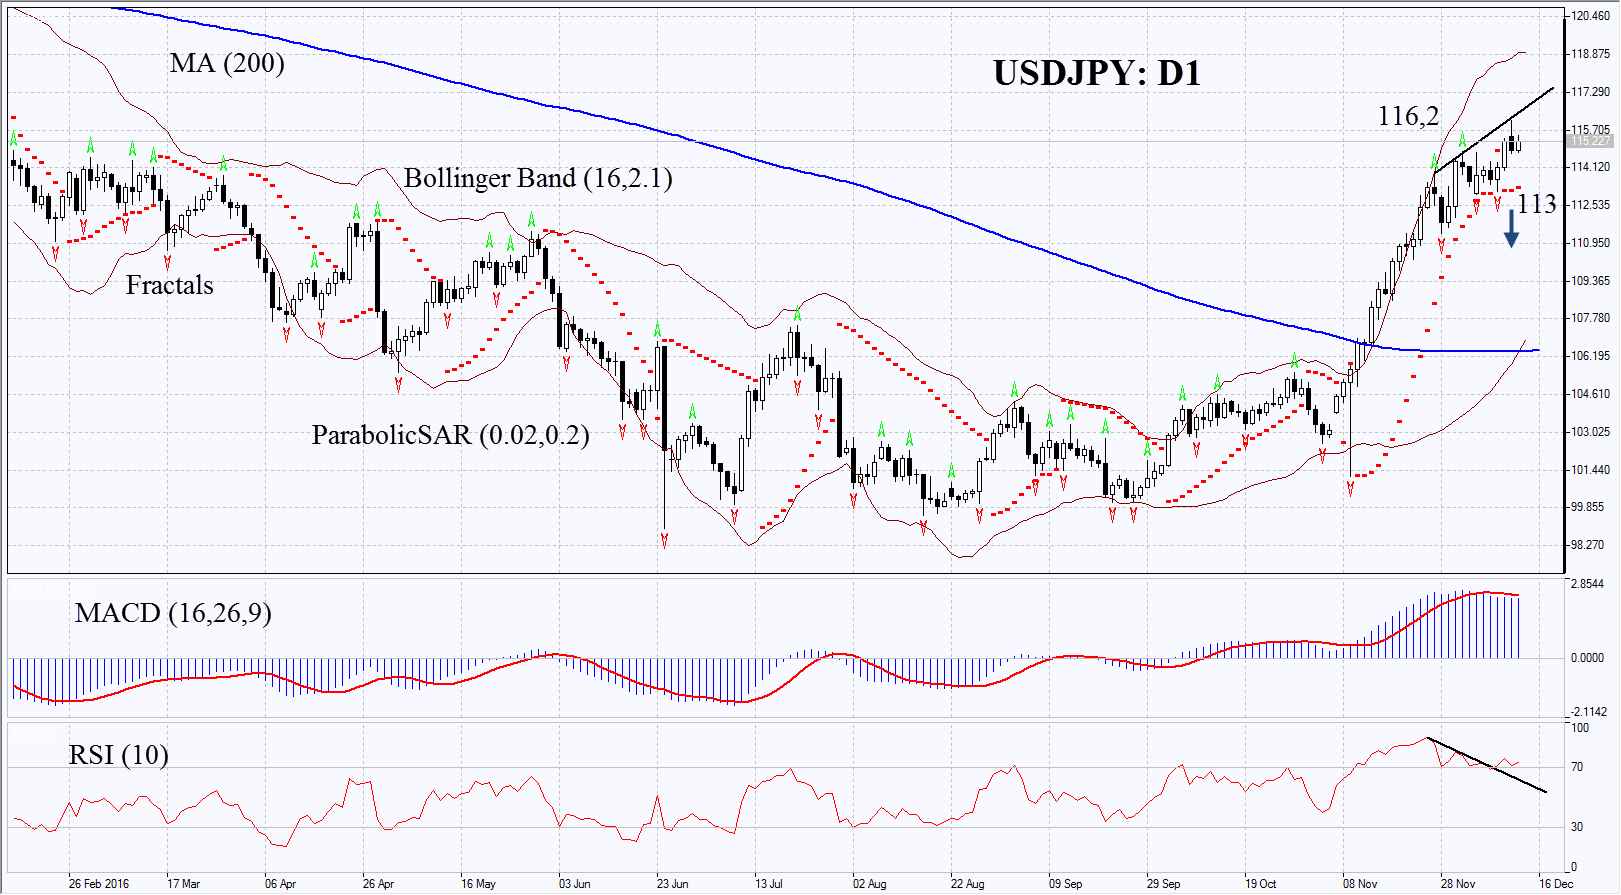
On the daily chart USDJPY: D1 is in rising trend. On Monday it hit a 10-month high. Nevertheless, its pace of growth slowed down and several technical indicators point at possible correction down. Further strengthening of yen is possible in case US dollar index strengthens more after the Fed meeting and in case positive economic data comes out in Japan.
- Parabolic gives bullish signal.
- Bollinger bands have widened a lot which means higher volatility.
- RSI is in the overbought zone. It has formed negative divergence.
- MACD gives bearish signals.
The bearish momentum may develop in case USDJPY fall below the two last fractal lows and Parabolic signal at 113. This level may serve the point of entry. The initial stop-loss may be placed above the 10-month high at 116.2. Having opened the pending order we shall move the stop to the next fractal high following the Parabolic and Bollinger signals. Thus, we are changing the probable profit/loss ratio to the breakeven point. The most risk-averse traders may switch to the 4-hour chart after the trade and place there a stop-loss moving it in the direction of the trade. If the price meets the stop-loss level at 116.2 without reaching the order at 113, we recommend cancelling the position: the market sustains internal changes which were not taken into account.
Summary of technical analysis
| Position | Sell |
| Sell stop | below 113 |
| Stop loss | above 116.2 |
Explore our
Trading Conditions
- Spreads from 0.0 pip
- 30,000+ Trading Instruments
- Stop Out Level - Only 10%
Ready to Trade?
Open Account Note:
This overview has an informative and tutorial character and is published for free. All the data, included in the overview, are received from public sources, recognized as more or less reliable. Moreover, there is no guarantee that the indicated information is full and precise. Overviews are not updated. The whole information in each overview, including opinion, indicators, charts and anything else, is provided only for familiarization purposes and is not financial advice or а recommendation. The whole text and its any part, as well as the charts cannot be considered as an offer to make a deal with any asset. IFC Markets and its employees under any circumstances are not liable for any action taken by someone else during or after reading the overview.
