- Analytics
- Technical Analysis
USD/TRY Technical Analysis - USD/TRY Trading: 2018-11-12
Preparing for the publication of important statistics
Inflation in Turkey in October 2018 increased and updated the high for the last 15 years. Will the USDTRY increase?
Such a movement indicates the weakening of the Turkish lira against the US dollar. In October, inflation in Turkey reached 25.24% year over year. It exceeded the rate of the Turkish Central Bank, which is 24%. An important factor for the exchange rate of the lira may be the data on the current account balance for September, which will be released on November 12, 2018, on Monday. A good surplus of $2 billion is expected. Of course, this is less than the surplus for August in the amount of $ 2.59 billion. However, a positive factor is that in August it was the first time in the last 3 years, and before that, the current account balance of Turkey was in a stable deficit. If there is a noticeable surplus in September, then, this may become the beginning of a positive trend. In case of negative data, the weakening of the lire can accelerate.
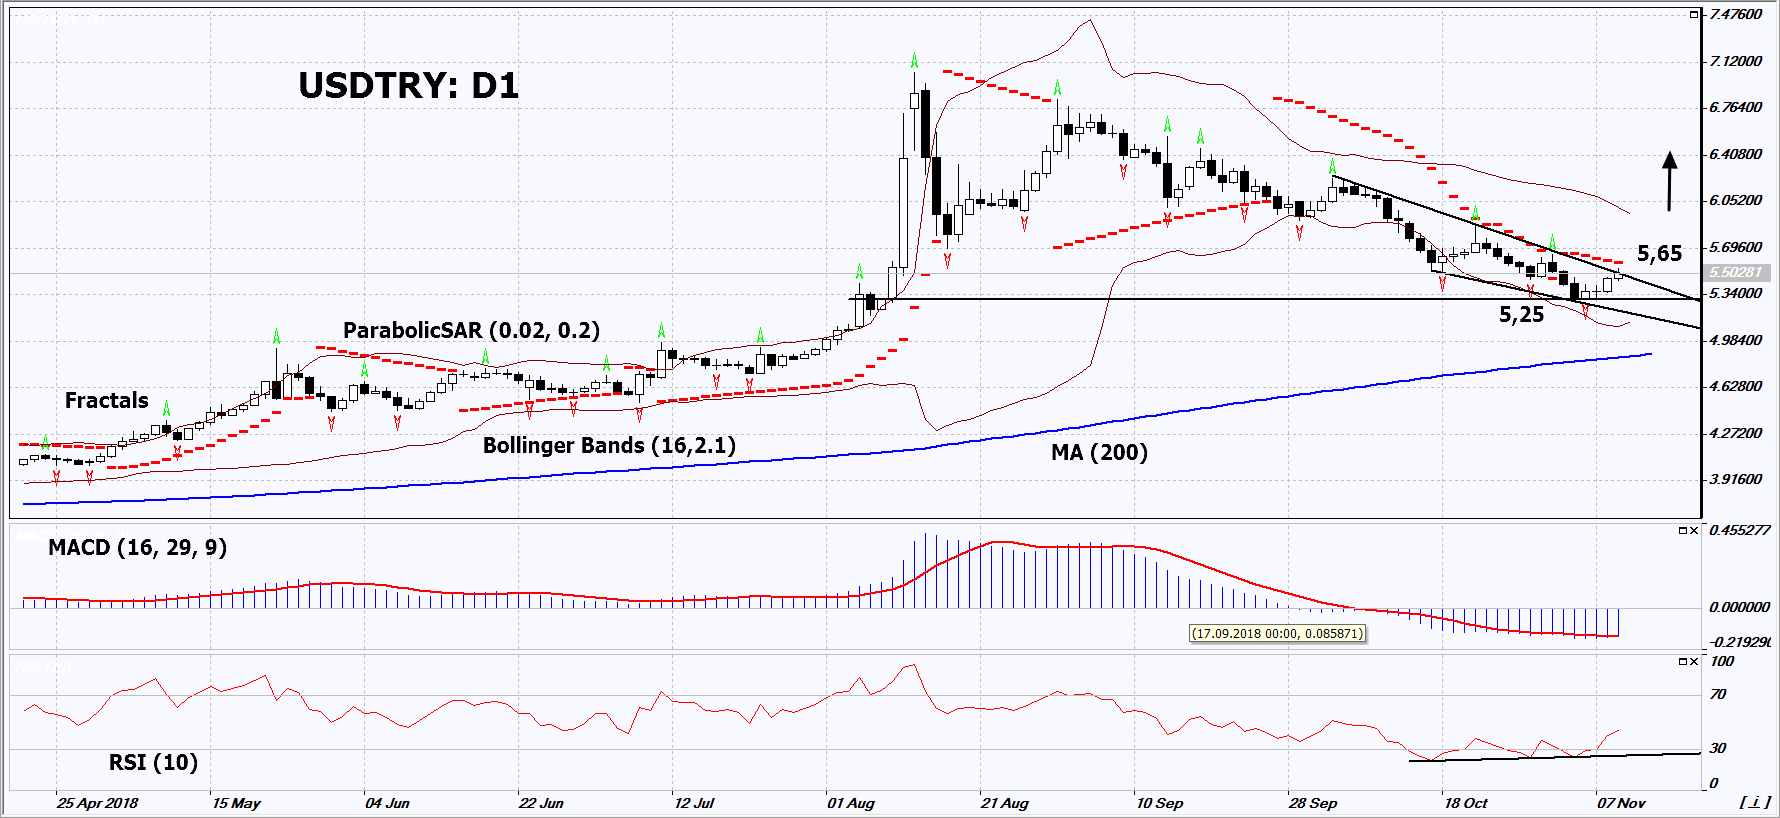
On the daily timeframe, USDTRY: D1 approached the resistance line of the downtrend and is correcting upwards from the 3-month low. The further price increase is possible in case of the publication of negative economic data in Turkey.
- The Parabolic indicator gives a bearish signal. It can be used as an additional resistance level, which must be overcome before opening a buy position.
- The Bollinger bands are narrowing, which indicates low volatility. The upper band is titled upwards.
- The RSI indicator is below 50. It has formed a positive divergence.
- The MACD indicator gives a bullish signal.
The bullish momentum may develop in case USDTRY exceeds the last fractal high and the Parabolic signal at 5.65. This level may serve as an entry point. The initial stop loss may be placed below the last fractal low and the 3-month low at 5.25. After opening the pending order, we shall move the stop to the next fractal low following the Bollinger and Parabolic signals. Thus, we are changing the potential profit/loss to the breakeven point. More risk-averse traders may switch to the 4-hour chart after the trade and place there a stop loss moving it in the direction of the trade. If the price meets the stop level (5.25) without reaching the order (5.65), we recommend cancelling the position: the market sustains internal changes that were not taken into account.
Summary of technical analysis
| Position | Buy |
| Buy stop | Above 5,65 |
| Stop loss | Below 5,25 |
Explore our
Trading Conditions
- Spreads from 0.0 pip
- 30,000+ Trading Instruments
- Stop Out Level - Only 10%
Ready to Trade?
Open Account Note:
This overview has an informative and tutorial character and is published for free. All the data, included in the overview, are received from public sources, recognized as more or less reliable. Moreover, there is no guarantee that the indicated information is full and precise. Overviews are not updated. The whole information in each overview, including opinion, indicators, charts and anything else, is provided only for familiarization purposes and is not financial advice or а recommendation. The whole text and its any part, as well as the charts cannot be considered as an offer to make a deal with any asset. IFC Markets and its employees under any circumstances are not liable for any action taken by someone else during or after reading the overview.
