- Analytics
- Technical Analysis
WHEAT Technical Analysis - WHEAT Trading: 2017-04-04
Wheat plantings are expected to decline in the US
The US Department of Agriculture (USDA) forecasts a decline in the US wheat crops to a historic low of 146.06 mln acres. Will wheat prices rise?
At the same time, the USDA expects a growth in the US wheat reserves to 1.655 bln bushels which is the highest level since 1988. Hot weather in India may become an additional factor for the growth of wheat prices. It may damage the crop in the current 2016/17 agricultural season. Previously, it was assumed that it would reach the historic high in India and would be 96.64 mln tonnes. Indian state wheat inventories dropped to 9.43 mln tonnes as of March 1, 2017, which is the lowest in 9 years. Some market participants do not exclude that in 2017/18 season the country would have to buy 2-3 mln tonnes of wheat in the world market.
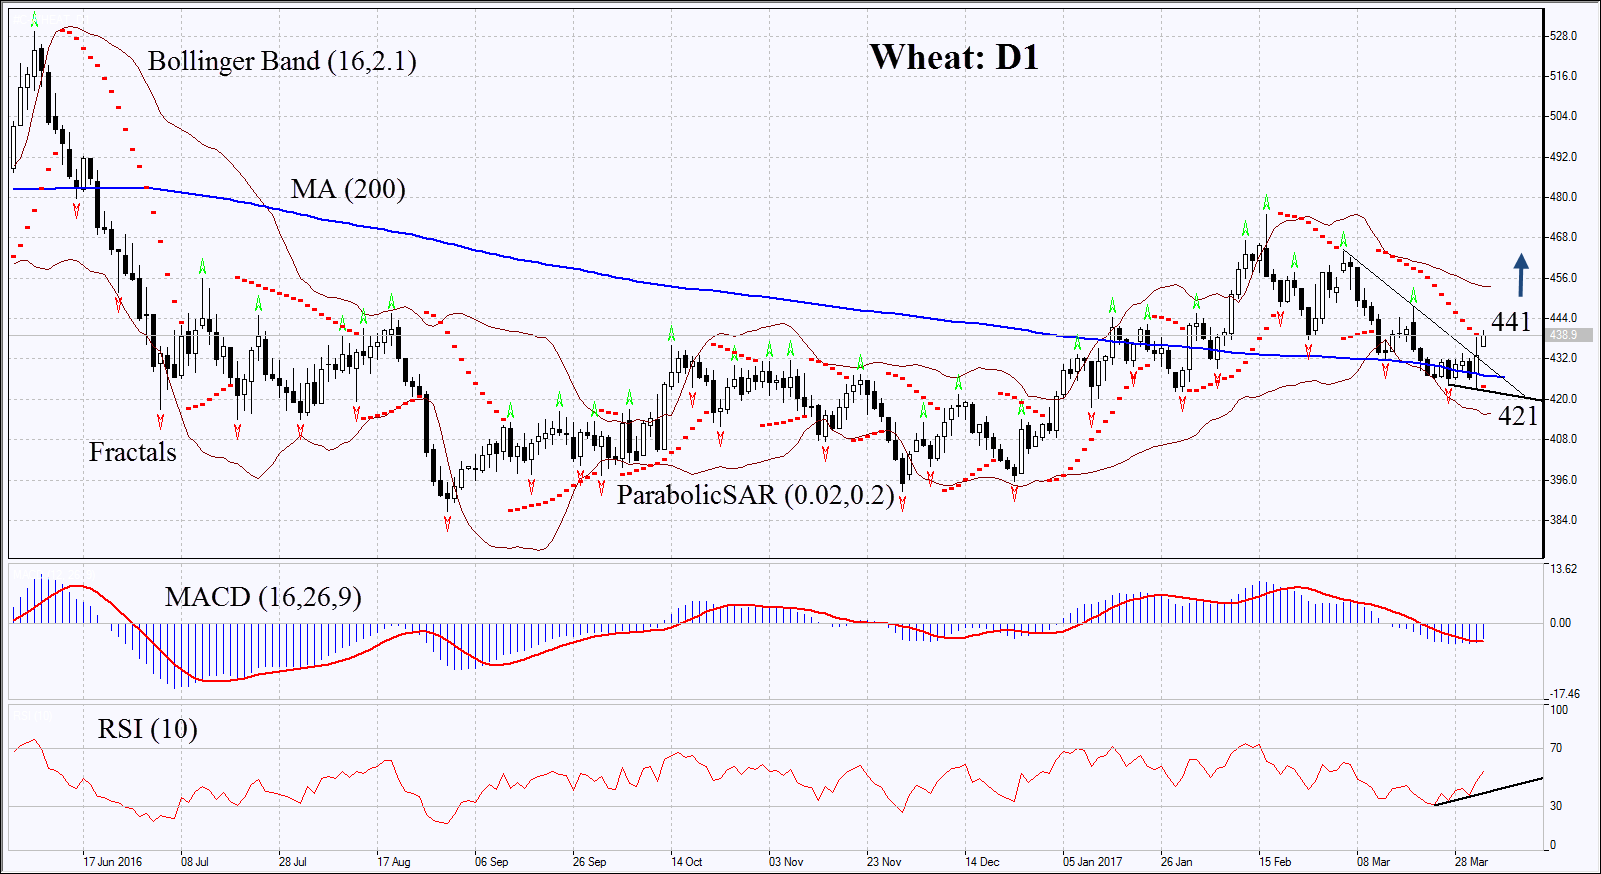
On the daily timeframe, Wheat: D1 breached above the resistance line of the downtrend. The further price increase is possible in case of crop reduction in the US and India.
- The Parabolic indicator gives bullish signals.
- The Bollinger bands have widened, which means higher volatility.
- The RSI rose above 50. It has formed a positive divergence.
- The MACD gives bullish signals.
The bullish momentum may develop in case Wheat exceeds the Monday record high at 441. This level may serve as the entry point. The initial stop-loss may be placed below the last fractal low, the 200-day moving average and the Parabolic signal at 421. After opening the pending order, we shall move the stop to the next fractal low following the Bollinger and Parabolic signals. Thus, we are changing the potential profit/loss to the breakeven point. More risk-averse traders may switch to the 4-hour chart after the trade and place there a stop-loss moving it in the direction of the trade. If the price meets the stop level at 421 without reaching the order at 441 we recommend cancelling the position: the market sustains internal changes that were not taken into account.
Technical Analysis Summary
| Position | Buy |
| Buy stop | 441 |
| Stop loss | 421 |
Explore our
Trading Conditions
- Spreads from 0.0 pip
- 30,000+ Trading Instruments
- Stop Out Level - Only 10%
Ready to Trade?
Open Account Note:
This overview has an informative and tutorial character and is published for free. All the data, included in the overview, are received from public sources, recognized as more or less reliable. Moreover, there is no guarantee that the indicated information is full and precise. Overviews are not updated. The whole information in each overview, including opinion, indicators, charts and anything else, is provided only for familiarization purposes and is not financial advice or а recommendation. The whole text and its any part, as well as the charts cannot be considered as an offer to make a deal with any asset. IFC Markets and its employees under any circumstances are not liable for any action taken by someone else during or after reading the overview.
