- Analytics
- Technical Analysis
Gold Technical Analysis - Gold Trading: 2014-11-06
Slump hesitation
Positive data on the US labor market was published yesterday. ADP Non-Farm Employment Change was above the projected level ( + 7%), and its previous performance value as well ( + 2%). The index is based on the anonymous data study of about 400,000 American business clients. Employment is the main factor which influences the consumer demand in the United States, and so when the indicator growth is rising above the expected level, it will certainly cause the US dollar consolidation, which was observed last night. At the same time, the gold futures updated its low. It should be noted that the US stock market is still in the recovery stage, and investors tend to turn down defensive assets in favour of risky operations.
However, the fretted markets are concerned about the European geopolitical uncertainty. A possibility of imposing new sanctions against Russia and Minsk agreements violation may trigger tension again in the eastern Ukraine. If that happens, the demand for defensive assets such as precious metals may start to rise and the XAU/USD price fall would slow down.
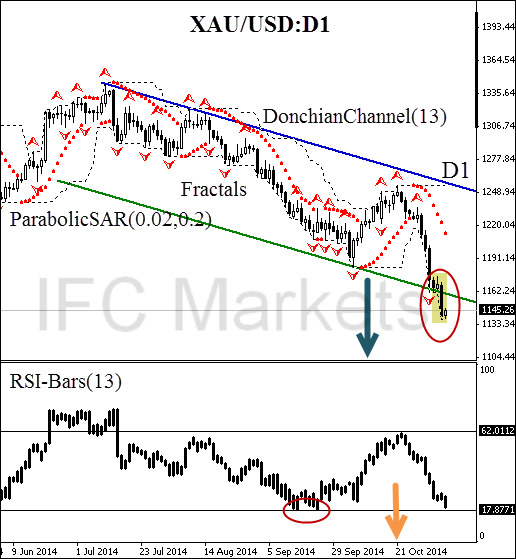
Considering all the confirmatory signals, a sell position can be opened at the current price mark. Stop Loss is to be placed above 1248.94. This mark is confirmed by the bearish trend line, and it is located above the Parabolic historical values. After position opening, Stop Loss is to be moved after the Parabolic values, near the next fractal high. Thus, we are changing the probable profit/loss ratio to the breakeven point.
| Position | Sell |
| Sell | current price |
| Stop loss | above 1248.94 |
- Get Certificate

Note:
This overview has an informative and tutorial character and is published for free. All the data, included in the overview, are received from public sources, recognized as more or less reliable. Moreover, there is no guarantee that the indicated information is full and precise. Overviews are not updated. The whole information in each overview, including opinion, indicators, charts and anything else, is provided only for familiarization purposes and is not financial advice or а recommendation. The whole text and its any part, as well as the charts cannot be considered as an offer to make a deal with any asset. IFC Markets and its employees under any circumstances are not liable for any action taken by someone else during or after reading the overview.
