- Analytics
- Technical Analysis
Exxon Stocks Technical Analysis - Exxon Stocks Trading: 2019-05-28
Oil processing profit margins may increase
We propose to consider the personal composite instrument (PCI) XOM_Brent in this analysis. It reflects the price dynamics of stocks of Exxon Mobil Corporation oil company against deliverable Brent futures. Will the XOM_Brent price increase?
An Increase in the PCI means Exxon Mobil stocks are rising faster than those of the crude oil. The first quarter earnings report of the company was weak despite a 2.4% increase in oil output. The company noted margin decline in chemical and oil processing sectors. The company recorded a quarterly loss in oil processing for the first time in 10 years. Theoretically, declining crude oil prices may raise the profit margin. A fall in global oil demand against the backdrop of US-Sino trade war and slowing global growth are main downside risks for Brent.
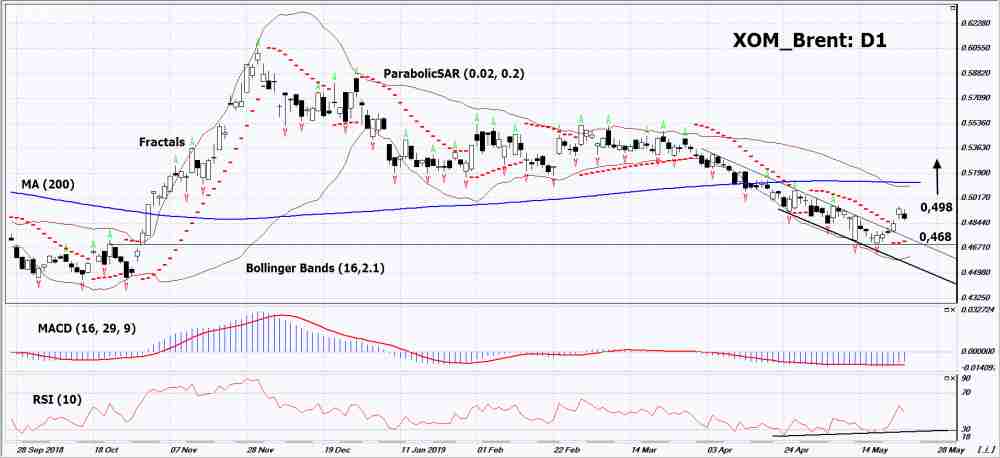
In the daily timeframe XOM_Brent: D1 has breached the resistance line of the downtrend. Some technical analysis indicators have formed signals for movement up. Further price increase is possible in case of improvement in Exxon Mobil financial indicators and stagnation in global oil market.
- Parabolic indicator gives a bullish signal.
- Bollinger lines have expanded, attesting to increasing volatility. Both Bollinger lines are tilted up.
- RSI indicator is below level 50. It has formed a bullish divergence.
- MACD indicator gives a bullish signal.
A bullish momentum may develop in case XOM_Brent exceeds the last fractal high: 0.498. This level may serve as an entry point. The initial stop loss may be placed below the last fractal low, the Parabolic signal: 0.468. After opening the pending order, we shall move the stop to the next fractal low following the Bollinger and Parabolic signals. Thus, we are changing the potential profit/loss to the breakeven point. More risk-averse traders may switch to the 4-hour chart after the trade and place a stop loss moving it in the direction of the trade. If the price meets the stop level (0.468) without reaching the order (0.498), we recommend to cancel the order: the market sustains internal changes that were not taken into account.
Summary of technical analysis
| Position | Buy |
| Buy stop | Above 0.498 |
| Stop loss | Below 0.468 |
Explore our
Trading Conditions
- Spreads from 0.0 pip
- 30,000+ Trading Instruments
- Stop Out Level - Only 10%
Ready to Trade?
Open Account Note:
This overview has an informative and tutorial character and is published for free. All the data, included in the overview, are received from public sources, recognized as more or less reliable. Moreover, there is no guarantee that the indicated information is full and precise. Overviews are not updated. The whole information in each overview, including opinion, indicators, charts and anything else, is provided only for familiarization purposes and is not financial advice or а recommendation. The whole text and its any part, as well as the charts cannot be considered as an offer to make a deal with any asset. IFC Markets and its employees under any circumstances are not liable for any action taken by someone else during or after reading the overview.
