- Analytics
- Market Sentiment
WEEKLY TOP GAINERS/LOSERS: 26.07.2018
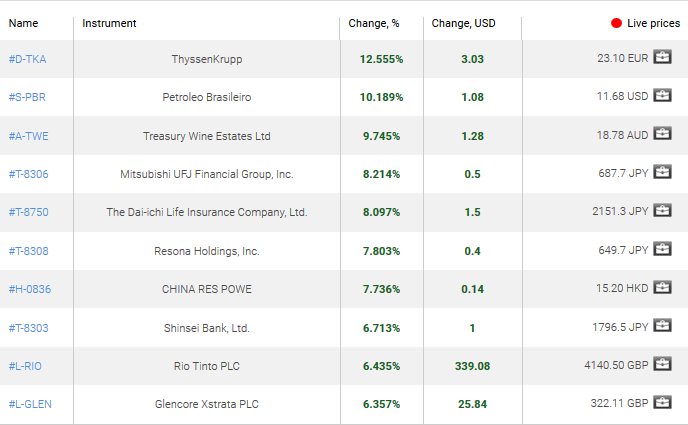
 Top Gainers – The World Market
1. ThyssenKrupp – stocks of the German steel company rose due to a good forecast by the financial company Kepler Cheuvreux, and an increase in the target level of their prices from 26 euros to 35 euros. The change in the forecast was made after the resignation of ThyssenKrupp CEO and plans to establish a joint company with Indian Tata Steel Ltd.
2. PetróleoBrasileiro S.A. – CFDs on stocks of the Brazilian oil company increased amid reports on the start of production in new fields in the 4th quarter of this year, as well as due to stable high world oil prices. On August 3, 2018, the company will publish its earnings reports for the second quarter.
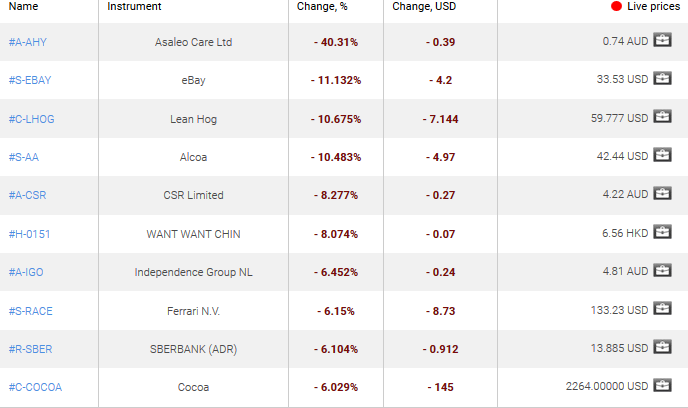
 Top Losers – The World Market
1. Asaleo Care Ltd – stock prices of the Australian company engaged in the production of hygiene products collapsed after the publication of weak earnings reports for the 2nd quarter of 2018 and a decrease in forecasts of financial indicators for the whole current year.
2. eBay Inc – stocks of the international Internet trading company fell after the publication of weak quarterly earnings reports.
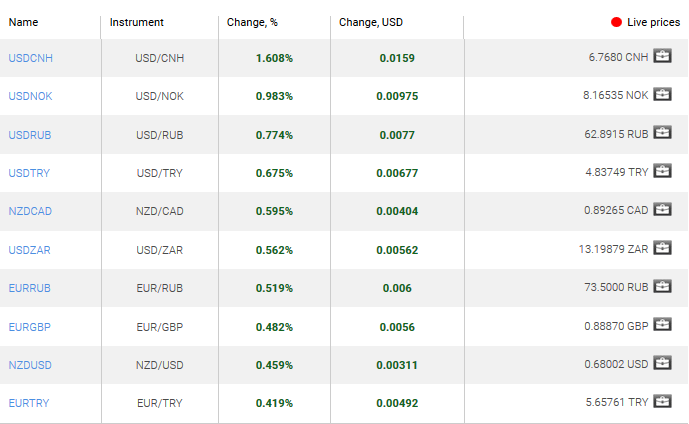
Top Gainers – Foreign Exchange Market (Forex)
1. USDCNH - the growth of the Chinese yuan on the chart indicates its weakening against the US dollar. The decrease in the yuan is a result of an increase in US duties on Chinese goods.
2. USDNOK - the growth of the Norwegian krone in the chart indicates its weakening against the US dollar. Such dynamics may be due to the increase in inflation in June of the current year to 2.6%, which is higher than the target level of the Central Bank of Norway - 2.5%. In June 2017, inflation was much lower and amounted to 1.9%.
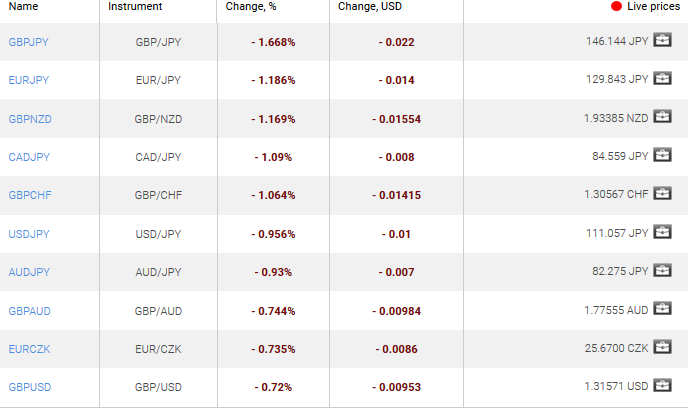
Top Losers - Foreign Exchange Market (Forex)
1. GBPJPY, EURJPY - the decline of these charts means the strengthening of the Japanese yen against the British pound and the euro. The Bank of Japan does not exclude the tightening of monetary policy. Investors expect more detailed information at its next meeting on July 31, 2018.
2. GBPNZD - the decline of this chart means the strengthening of the New Zealand dollar against the British pound. The New Zealand dollar exchange rate rose amid an increase in inflation in the 2nd quarter to 1.5% year over year, compared with 1.1% in the first quarter. Some market participants believe that if consumer price growth accelerates to 2% by the end of the year, the Reserve Bank of New Zealand may tighten its monetary policy.
New Exclusive Analytical Tool
Any date range - from 1 day to 1 year
Any Trading Group - Forex, Stocks, Indices, etc.
Note:
This overview has an informative and tutorial character and is published for free. All the data, included in the overview, are received from public sources, recognized as more or less reliable. Moreover, there is no guarantee that the indicated information is full and precise. Overviews are not updated. The whole information in each overview, including opinion, indicators, charts and anything else, is provided only for familiarization purposes and is not financial advice or а recommendation. The whole text and its any part, as well as the charts cannot be considered as an offer to make a deal with any asset. IFC Markets and its employees under any circumstances are not liable for any action taken by someone else during or after reading the overview.
- Get Certificate


Last Sentiments
- 18Mar2021Weekly Top Gainers/Losers: Canadian dollar and Japanese yen
Over the past 7 days, prices for oil, non-ferrous metals and other mineral raw materials decreased but still remained high. As a result, the currencies of the commodity countries strengthened: the Canadian dollar, the Australian and New Zealand dollars, the Mexican peso, and the South African rand. The...
- 10Mar2021Weekly Top Gainers/Losers: Canadian dollar and New Zealand dollar
Оil quotes continued to rise over the past 7 days. Against this background, the currencies of oil-producing countries, such as the Russian ruble and the Canadian dollar, strengthened. The New Zealand dollar weakened after the announcement of negative economic indicators: ANZ Business Confidence and...
- 4Mar2021Weekly Top Gainers/Losers: American dollar and South African rand
Over the past 7 days, oil quotes continued to grow. Precious metals, including gold, fell in price. Against this background, the shares of oil companies increased, the Russian ruble strengthened, the Australian and New Zealand dollars, as well as the South African rand, weakened. The US dollar strengthened...