- Analytics
- Technical Analysis
Qualcomm Technical Analysis - Qualcomm Trading: 2019-06-14
Will the court ruling against Qualcomm continue weighing on its stock?
Analysts estimate the negative impact from court’s decision will be limited on Qualcomm. Will the Qualcomm stock price continue rebounding?
Qualcomm is the world’s biggest producer of mobile phone chips and the leader in 5G tech. Its stock dropped 12%, the biggest fall in more than two year, on May 22 after a federal judge ruled against Qualcomm in a dispute with the U.S. Federal Trade Commission, finding that the company used its dominant position to harm competition and charge smartphone makers excessive licensing fees. Before that Qualcomm stock rallied over 50% after the chip giant came to a settlement with Apple, granting Qualcomm licensing rights while becoming the 5G supplier for iPhone. Qualcomm released second quarter earnings in the beginning of May, reporting higher profit while revenue fell to $4.88 billion, but beat analysts’ estimates of $4.80 billion. The company forecast $1.23 billion to $1.33 billion in revenue for its licensing business in the third quarter, above analysts’ consensus forecast of $1.22 billion. While Qualcomm will be appealing the ruling, analysts point that the negative impact from court’s decision will be limited as the company prepares for rollout of 5G mobile phones as the year ends. The next earnings statement is scheduled for July 24. The continued US-China trade dispute remains the major downside risk for Qualcomm.
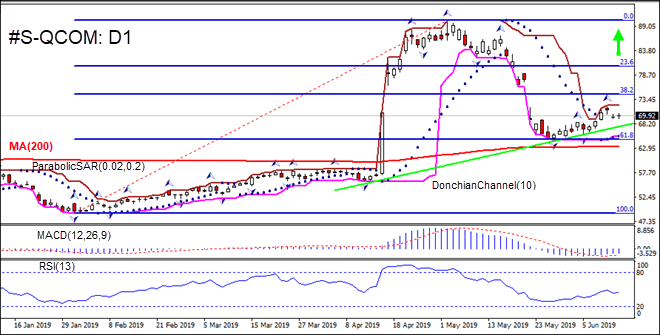
On the daily timeframe the S-QCOM: D1 is rising above the 200-day moving average MA(200) and Fibonacci 61.8. It is also above the support line. These are bullish developments.
- The Parabolic indicator has formed a buy signal.
- The Donchian channel indicates uptrend: it is tilted up.
- The MACD indicator gives a bullish signal: it is below the signal line and the gap is narrowing.
- The RSI oscillator is rising but has not reached the overbought zone yet.
We believe the bullish momentum will continue after the price breaches above the upper boundary of Donchian channel at 72.17. This level can be used as an entry point for placing a pending order to buy. The stop loss can be placed below the fractal low at 64.75. After placing the order, the stop loss is to be moved every day to the next fractal low, following Parabolic signals. Thus, we are changing the expected profit/loss ratio to the breakeven point. If the price meets the stop loss level (64.75) without reaching the order (72.17), we recommend cancelling the order: the market has undergone internal changes which were not taken into account.
Technical Analysis Summary
| Position | Buy |
| Buy stop | Above 72.17 |
| Stop loss | Below 64.75 |
Explore our
Trading Conditions
- Spreads from 0.0 pip
- 30,000+ Trading Instruments
- Stop Out Level - Only 10%
Ready to Trade?
Open Account Note:
This overview has an informative and tutorial character and is published for free. All the data, included in the overview, are received from public sources, recognized as more or less reliable. Moreover, there is no guarantee that the indicated information is full and precise. Overviews are not updated. The whole information in each overview, including opinion, indicators, charts and anything else, is provided only for familiarization purposes and is not financial advice or а recommendation. The whole text and its any part, as well as the charts cannot be considered as an offer to make a deal with any asset. IFC Markets and its employees under any circumstances are not liable for any action taken by someone else during or after reading the overview.
