

- Education
- Forex Technical Analysis
- Technical Indicators
- Bill Williams Indicators
- Bill Williams Alligator
Bill Williams Alligator Indicator
Bill Williams spent decades as both a trader and a psychologist, and the Alligator indicator was his attempt to merge those two backgrounds into a single tool. He introduced it in his 1995 book Trading Chaos, as part of a broader framework he called "Trading Chaos" - an approach borrowing from chaos theory, which studies how apparently random systems actually follow hidden structures.
Williams argued that price charts behave the same way: underneath the noise, markets alternate between long stretches of directionless drift and short, powerful bursts of trend. His estimate, based on years of chart study, was that markets only trend somewhere between 15% and 30% of the time, the rest is consolidation that eats away at the account of anyone trading it.
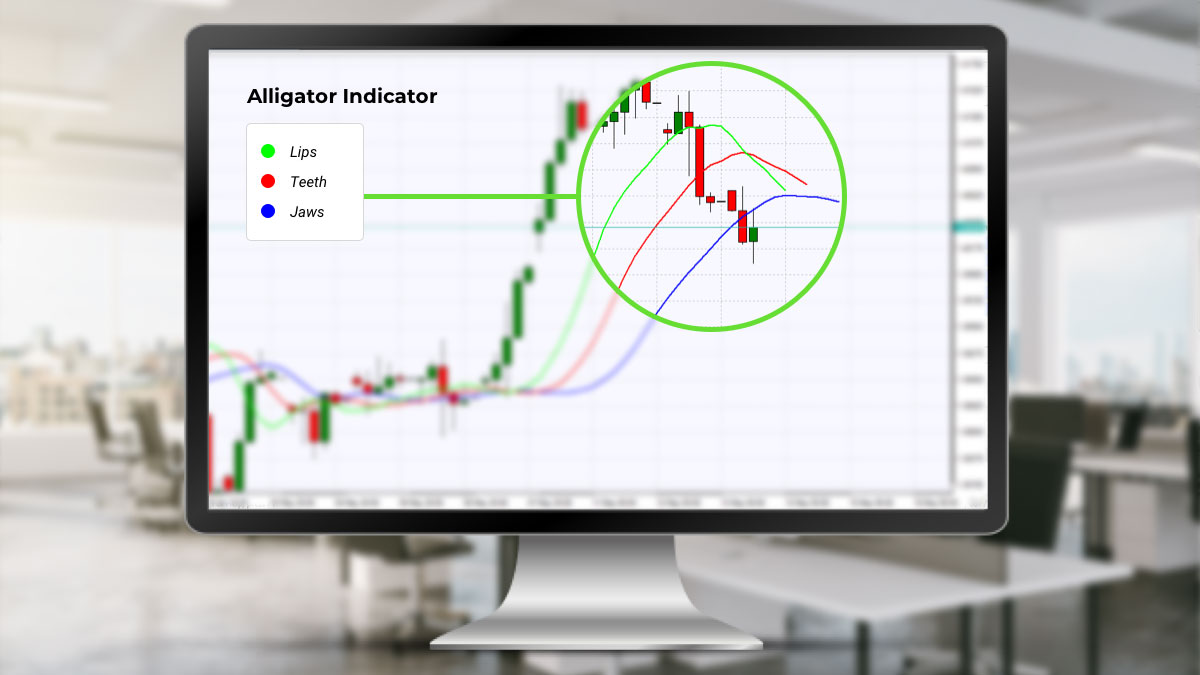
The Alligator was built to tell a trader, at a glance, which of those two states the market is currently in. It does this with three lines laid directly over price, nicknamed for the way they resemble a reptile's jaw, teeth, and lips opening and closing.
In this article we cover how those lines are actually built, what each one means on its own, and the specific rules traders use to turn the indicator into entries, stops, and exits.
Key Moments
- Alligator indicator consists of three smoothed moving averages of 5, 8, and 13 periods, Fibonacci numbers, each shifted forward in time rather than plotted at the current bar.
- Tight overlapping lines means the market is in a low-probability, range-bound state that Williams' research suggested accounts for the majority of all price action.
- Because it is built from moving averages, the indicator is inherently a lagging tool: by the time it confirms a trend, price has usually already moved a meaningful distance in that direction.
What Is Alligator Indicator
Alligator indicator is a technical analysis tool that lays three smoothed moving averages of different lengths, each offset into the future, to reveal whether a market is trending or consolidating and, if trending, in which direction.
Alligator is not only measuring speed of price change, it is also measuring the relationship between three different time horizons at once.
- The fastest line reacts to what's happening right now,
- the middle line reflects a slightly longer view,
- and the slowest line anchors the medium-term picture.
Bill Williams 3 Lines
Each line is a smoothed moving average (SMMA) of the median price — calculated as the high plus the low, divided by two. A smoothed moving average differs from a simple moving average in how it treats history: after the first value is calculated as an ordinary average, every subsequent value blends in the new price while retaining a weighted memory of all prior values, which makes the line noticeably smoother and slower to react than a standard moving average of the same length.
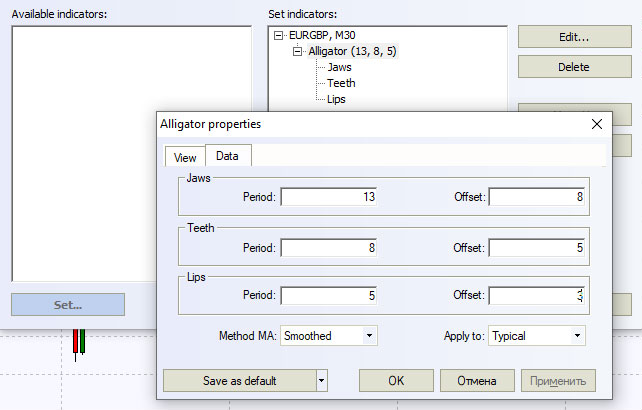
The three lines, and the periods and forward shifts are:
- Jaw (blue) — a 13-period SMMA, shifted 8 bars into the future. This is the slowest of the three, and it marks the outer boundary of the medium-term trend.
- Teeth (red) — an 8-period SMMA, shifted 5 bars into the future. It sits between the other two, both in speed and in the role it plays.
- Lips (green) — a 5-period SMMA, shifted 3 bars into the future. This is the fastest line, and it's the first to react whenever the balance between buyers and sellers shifts.
The periods (13, 8, 5) and the shifts (8, 5, 3) are all Fibonacci numbers, which Williams favored throughout his work based on his view that Fibonacci ratios recur naturally in market structure. The forward displacement is what gives the indicator its distinctive "mouth" shape: rather than laying each average directly above the price that produced it, the value is pushed several bars ahead, so that when the three lines separate, they visually fan outward like an open jaw.
The Three States of the Market
Williams described the Alligator's behavior in three phases, and almost everything about trading with the indicator comes down to correctly identifying which phase is currently showing on the chart.
Sleeping
The three lines are tangled together, repeatedly crossing over one another while drifting sideways in a narrow band. This is the state Williams associated with the bulk of all price action, a market with no edge, where most participants trading a directional strategy will slowly lose money to noise. The longer this phase lasts, the more restrained activity tends to arise after it ends, much like a real alligator gets hungrier the longer it rests.
Waking
The lines begin to separate and point the same way. The order in which this happens matters: the Lips move first, since they react fastest to new price information, followed by the Teeth, with the Jaw, the slowest and most deeply smoothed line, confirming the move last. A partial separation, where only one or two lines have turned, is considered an early and less reliable signal than a full alignment of all three.
Eating
All three lines are clearly separated and correctly ordered in the direction of the trend: Lips furthest from price in a strong move, Teeth in the middle, Jaw trailing behind. Price typically trades above or below all three lines during this phase. This is the highest confidence state for holding a position, and Williams's guidance was to stay in a trending position for as long as this alignment holds, rather than exiting at the first sign of a pullback.
Alligator Indicator Formula (Calculation)
The calculation of the Alligator indicator is terrifying at first glance, yet here we go
SMA:
- SUM1 = SUM (CLOSE, N)
- SMMA1 = SUM1/N
- Subsequent values are:
- PREVSUM = SMMA(i-1) *N
- SMMA(i) = (PREVSUM-SMMA(i-1)+CLOSE(i))/N
Where
SUM1 - the sum of closing prices for N periods;
PREVSUM - smoothed sum of the previous bar;
SMMA1 - smoothed moving average of the first bar;
SMMA(i) - smoothed moving average of the current bar (except for the first one);
CLOSE(i) - current closing price;
N - the smoothing period.
How to Use Alligator Indicator
The core rule traders take from the Alligator is simple to state: when the mouth opens, it signals that you should enter a trade. With steps below we will explain what that means in practice, from reading the lines to managing a position once you're in one.
Step 1: Confirm the market is asleep before you do anything
Before looking for an entry, check that the three lines were recently tangled together and moving sideways. This matters because the strength of an eventual signal is tied to how long the preceding rest period lasted, a breakout from a long consolidation tends to carry more follow through than one from a market that was barely resting at all.
If the lines are already stretched apart when you start watching the chart, you've likely missed the early part of the move and are looking at a trend that's already underway.
Step 2: Wait for the lines to separate in the correct order
A genuine wake up shows the Lips crossing away from the Teeth and Jaw first, with the other two lines following in sequence. Watch specifically for the point where all three lines are correctly stacked: Lips, Teeth, then Jaw for an emerging uptrend, or the reverse order for a downtrend.
Traders treat a partial or disordered separation, where the lines cross but don't settle into a clean stack, as unreliable and wait for confirmation before acting.
Step 3: Confirm the direction with a fractal
Williams designed the Alligator to work alongside his Fractals indicator, which marks a high or low that has two lower highs (or higher lows) on either side of it.
The rule
- If a bullish fractal forms above the Teeth line, it's treated as a valid signal to place a buy-stop order one tick above the fractal's high;
- If a bearish fractal forms below the Teeth, a sell-stop is placed one tick below its low.
A fractal that forms inside the tangle of the three lines, before they've separated, is ignored, the entry only becomes valid once price is clearly on one side of the Alligator's mouth.
Step 4: Let price trigger the order
Instead of entering the moment you see the pattern, the pending buy-stop or sell-stop order from step 3 is executed only after the price actually breaks the fractal level. This has a practical benefit: it prevents entries into setups that look promising based on the lines alone but fail to attract sufficient subsequent buying or selling to overcome the recent swing point. If the price never reaches the order, the trade is not executed, and the fractal is eventually replaced by a new one as the chart evolves.
Step 5: Place a stop and let the trend run
A stop-loss sits just beyond the opposite fractal, below the recent swing low for a buy, above the recent swing high for a sell. From there stay with the position, since the indicator's main strength is capturing the small percentage of time markets actually trend strongly.
Step 6: Exit when the alignment breaks down
The exit signal mirrors the entry - traders watch the lines themselves. It’s a common rule to close a long position once a candle closes below the Teeth (red) line, since that marks the point where the fastest reacting part of the indicator has lost the trend. A more conservative approach waits for the Lips to fully cross back through the Teeth and Jaw in the opposite direction, which is a slower signal, but less prone to closing a position on a brief pullback within an otherwise intact trend.
Conclusion
The Alligator indicator's real contribution is the discipline of separating "no trend" from "trend" before deciding whether to be in the market at all. Three moving averages, built at different speeds and offset in time so they visually fan apart during a real move, give traders a way to see that distinction rather than having to infer it from price alone.
That same construction is also its central weakness. Because every line is a moving average, the indicator is structurally a lagging one: it confirms a trend only after it has already begun, and the further shifted Jaw line in particular can leave a trader entering well after the earliest, most profitable part of a move has passed.
In sideways or low volatility conditions, the lines cross back and forth often enough to generate a steady stream of false starts. That is precisely why Williams never intended the Alligator to be used in isolation, pairing it with Fractals for entry timing and the Awesome Oscillator for momentum confirmation was the whole point.
Used that way, and with realistic expectations about how often markets actually trend, the Alligator remains a very useful indicator for reading a chart, three decades after it was introduced.
Forex Indicators FAQ
What is a Forex Indicator?
Forex technical analysis indicators are regularly used by traders to predict price movements in the Foreign Exchange market and thus increase the likelihood of making money in the Forex market. Forex indicators actually take into account the price and volume of a particular trading instrument for further market forecasting.
What are the Best Technical Indicators?
Technical analysis, which is often included in various trading strategies, cannot be considered separately from technical indicators. Some indicators are rarely used, while others are almost irreplaceable for many traders. We highlighted 5 the most popular technical analysis indicators: Moving average (MA), Exponential moving average (EMA), Stochastic oscillator, Bollinger bands, Moving average convergence divergence (MACD).
How to Use Technical Indicators?
Trading strategies usually require multiple technical analysis indicators to increase forecast accuracy. Lagging technical indicators show past trends, while leading indicators predict upcoming moves. When selecting trading indicators, also consider different types of charting tools, such as volume, momentum, volatility and trend indicators.
Do Indicators Work in Forex?
There are 2 types of indicators: lagging and leading. Lagging indicators base on past movements and market reversals, and are more effective when markets are trending strongly. Leading indicators try to predict the price moves and reversals in the future, they are used commonly in range trading, and since they produce many false signals, they are not suitable for trend trading.

Not sure about your Forex skills level?
Take a Test and We Will Help You With The Rest
You can see the graphical object on the price chart by downloading one of the trading terminals offered by IFC Markets.



Was this article helpful?

 You can study CFD trading more thoroughly and see CFD trading examples in the section How To Trade CFDs Visit Educational Center