- Education
- Forex Technical Analysis
- Technical Indicators
- Oscillators
- Slow Stochastic
Slow Stochastic: Definition, Formula and How to Use
When it comes to analyzing financial markets, technical indicators play a crucial role in providing insights and identifying potential trading opportunities. One such popular indicator is the Slow Stochastic, which is widely used by traders and investors. Slow Stochastic is a momentum oscillator that helps determine overbought and oversold conditions in the market. It is a useful tool for identifying trend reversals and generating buy or sell signals.
In this article we are going to talk about the essence of Slow Stochastic, indicator’s formula and its calculation, also common settings, and at the end we will show how to use Slow Stochastic indicator with examples.

What is Slow Stochastic
When it comes to analyzing financial markets, technical indicators play a crucial role in providing insights and identifying potential trading opportunities. One such popular indicator is the Slow Stochastic, which is widely used by traders and investors. Slow Stochastic is a momentum oscillator that helps determine overbought and oversold conditions in the market. It is a useful tool for identifying trend reversals and generating buy or sell signals.
How to Use Slow Stochastic
Here are some practical applications of the slow stochastic oscillator:
To Identify Overbought and Oversold Conditions
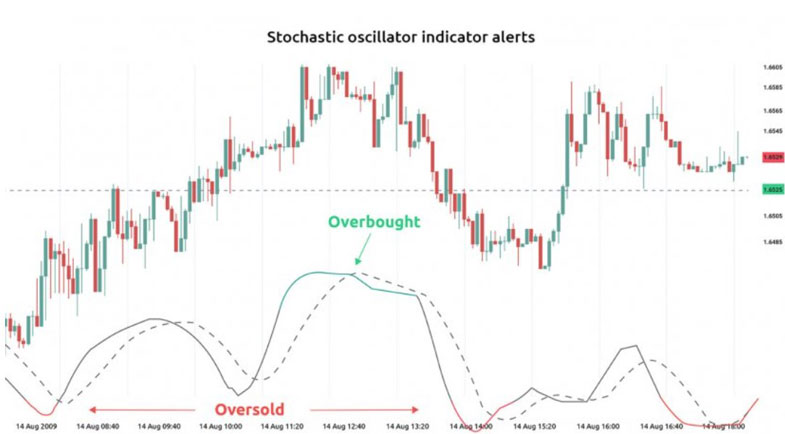
Traders can use the slow stochastic oscillator to recognize overbought conditions when it is above 80, indicating a potential correction, or oversold conditions when it is below 20, suggesting a potential rebound.

To Generate Trading Signals
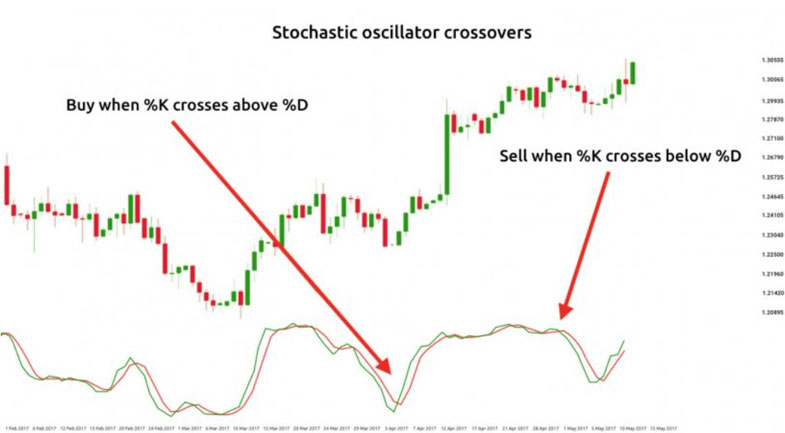
Traders often use the slow stochastic oscillator to generate trading signals. For instance, a common signal is to buy when the slow stochastic oscillator crosses above 80 and sell when it crosses below 20.

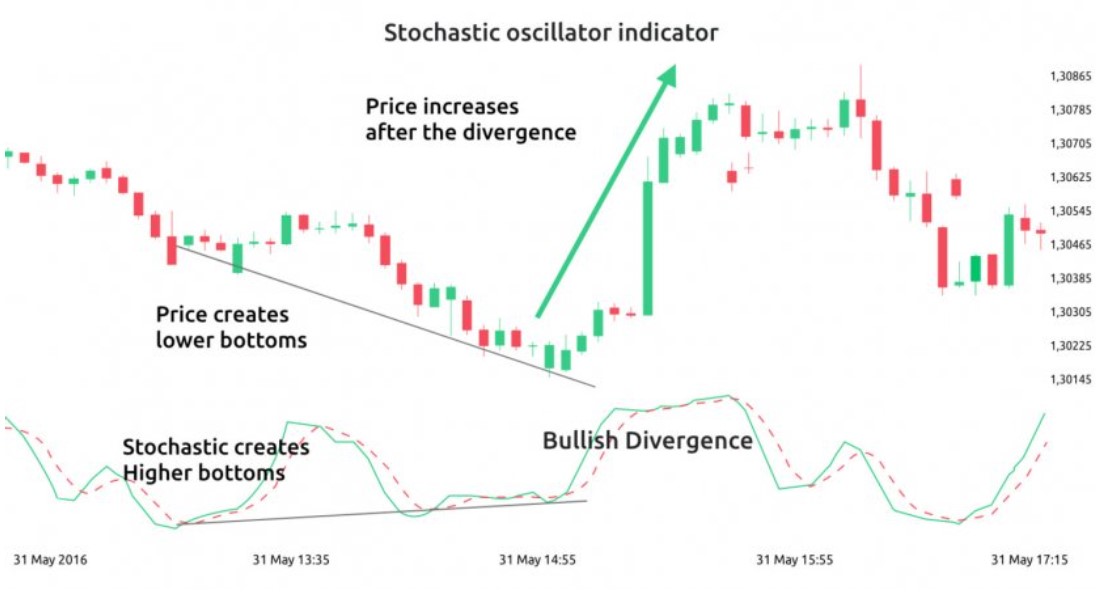
For example you can see from this chart that a stochastic oscillator creates higher bottoms which is a sign for trend reversal, plus %K crosses above %D, which is also a sign for uptrend.

It's important to note that the slow stochastic oscillator is a lagging indicator, meaning it may not immediately respond to price changes, making it less reliable for short-term signals. However, it can be valuable for identifying longer-term trends.
Consider the following additional tips when using the slow stochastic oscillator:
- Utilize multiple time frames: Analyzing the slow stochastic oscillator across various time frames can help identify trends and patterns that may be missed on a single time frame.
- Combine with other technical indicators: The slow stochastic oscillator can be used alongside other technical indicators, such as the MACD indicator, to validate trading signals.
- Adjust the lookback period: The lookback period, used in calculating the slow stochastic oscillator, can be adjusted to match your trading style. Shorter periods may suit short-term traders, while longer periods may be more suitable for longer-term analysis.
- Employ risk management techniques: While the slow stochastic oscillator can provide valuable insights, it is not infallible. It's essential to incorporate other risk management techniques, such as setting stop-loss orders and determining appropriate position sizes.
Slow Stochastic Formula
%K = (Current Close - Lowest Low)/(Highest High - Lowest Low) * 100
%D = 3-day SMA of %K
Where:
- %K is the fast stochastic oscillator
- %D is the slow stochastic oscillator
- Current Close is the most recent closing price
- Lowest Low is the lowest low price over the lookback period
- Highest High is the highest high price over the lookback period
- SMA is the simple moving average
The slow stochastic oscillator is typically plotted on a chart with a range of 0 to 100. Values above 80 indicate overbought conditions, while values below 20 indicate oversold conditions.
Let's break down the formula step by step:
- Calculate the %K line: %K = (Current Close - Lowest Low) / (Highest High - Lowest Low) * 100
In this equation, the "Current Close" represents the most recent closing price, the "Lowest Low" represents the lowest low price over the specified period, and the "Highest High" represents the highest high price over the same period. - Smooth the %K line: %D = Simple Moving Average of %K over a specified period
The %D line is a moving average of the %K line, typically calculated over three or five periods. The moving average helps smooth out the fluctuations in the %K line, providing a clearer indication of the trend.
Slow Stochastic Calculation
To calculate the Slow Stochastic indicator, follow these steps:
- Determine the desired period: Choose a specific number of periods, such as 14, to calculate the Slow Stochastic.
- Collect the necessary price data: Gather the closing prices, highest high prices, and lowest low prices over the chosen period.
- Calculate the %K line for each period: Apply the %K formula mentioned earlier to calculate the %K value for each period.
- Calculate the %D line: Calculate the simple moving average of the %K values over a specified period, usually three or five periods, to derive the %D line.
- Plot the Slow Stochastic indicator: Plot the %K and %D lines on a chart, typically ranging from 0 to 100, to visualize the Slow Stochastic indicator.
Let's assume we have the following closing prices for a particular stock over a 14-day period:
Now, let's calculate the Slow Stochastic indicator using the default settings of 14 periods for %K and 3 periods for %D.
Step 1: Calculate the %K line To calculate the %K line, we need to determine the highest high and lowest low prices over the 14-day period.
Highest High: $55
Lowest Low: $45
Now, let's calculate the %K value for each day using the %K formula:
%K = (Current Close - Lowest Low) / (Highest High - Lowest Low) * 100
Step 2: Calculate the %D line To calculate the %D line, we need to take the 3-day simple moving average of the %K values.
| Day | Closing Price ($) | %K | %D |
|---|---|---|---|
| 1 | $50 | 50% | - |
| 2 | $52 | 70% | - |
| 3 | $49 | 40% | - |
| 4 | $48 | 30% | 53.33% |
| 5 | $45 | 0% | 46.67% |
| 6 | $47 | 20% | 23.33% |
| 7 | $49 | 40% | 16.67% |
| 8 | $52 | 70% | 20% |
| 9 | $55 | 100% | 43.33% |
| 10 | $55 | 80% | 70% |
| 11 | $51 | 60% | 83.33% |
| 12 | $50 | 50% | 80% |
| 13 | $48 | 30% | 63.33% |
| 14 | $51 | 60% | 46.67% |
In this table, the "Closing Price" column represents the daily closing prices of the stock, the "%K" column shows the calculated %K values based on the Slow Stochastic formula, and the "%D" column displays the calculated %D values using a 3-day simple moving average.
Now that we have calculated the %K and %D lines for each day, we can plot them on a chart to visualize the Slow Stochastic indicator and analyze the potential overbought or oversold conditions and trend reversals.
Slow Stochastic Settings
When using the Slow Stochastic indicator, traders have the flexibility to adjust the settings based on their trading strategy and the timeframe they are analyzing. The default settings for the Slow Stochastic are typically 14 periods for %K and 3 periods for %D. However, these settings can be modified to suit individual preferences and market conditions.
Period Length
The period length refers to the number of data points or time periods used in the calculation of the Slow Stochastic indicator. The default setting of 14 periods is commonly used, but traders may choose shorter or longer periods depending on their trading style and the timeframe they are focusing on.
Shorter periods, such as 7 or 9, can provide more sensitive and frequent signals, but they may also generate more false signals. Conversely, longer periods, such as 20 or 25, can smooth out the indicator but may lag behind price movements.
%K Smoothing Period
The %K smoothing period determines the number of periods used to calculate the moving average of the %K line. The default setting is often 3 periods.
Increasing the smoothing period can further smooth out the %K line and potentially reduce false signals, but it may also delay the indicator's responsiveness to price changes. On the other hand, decreasing the smoothing period can make the %K line more responsive but may increase noise and false signals.
It's important to note that the Slow Stochastic settings should be adjusted in conjunction with the trading timeframe and the characteristics of the specific market being analyzed. What works well for one market or timeframe may not be as effective for another.
Traders should experiment with different settings and backtest their results on historical data to find the optimal parameters for their trading strategy. Experimenting with different settings and backtesting the results on historical data can help traders find the optimal parameters for their specific trading style and market conditions.
Ultimately, traders should strive to find a balance between sensitivity and reliability when adjusting the Slow Stochastic settings. By fine-tuning these parameters and considering market context, traders can harness the power of the indicator to aid their analysis and decision-making process.
Bottom line on Slow Stochastic
The Slow Stochastic indicator is a valuable tool for traders and investors looking to analyze market trends and identify potential trading opportunities.
By understanding how to use the Slow Stochastic and interpreting its signals correctly, traders can gain insights into overbought or oversold conditions and potential trend reversals. Remember that no indicator is infallible, and it should always be used in conjunction with other technical analysis tools and indicators to confirm signals.
Traders should also be cautious when relying solely on the Slow Stochastic indicator and consider incorporating risk management strategies into their trading plans. Proper risk management, including the use of stop-loss orders and position sizing, can help protect against potential losses and improve overall trading performance.
In conclusion, the Slow Stochastic indicator is a widely used technical analysis tool that can assist traders in making informed trading decisions.
With a solid understanding of its formula, calculation, and interpretation, traders can leverage the Slow Stochastic to enhance their trading strategies and potentially increase their chances of success in the financial markets.
Forex Indicators FAQ
What is a Forex Indicator?
Forex technical analysis indicators are regularly used by traders to predict price movements in the Foreign Exchange market and thus increase the likelihood of making money in the Forex market. Forex indicators actually take into account the price and volume of a particular trading instrument for further market forecasting.
What are the Best Technical Indicators?
Technical analysis, which is often included in various trading strategies, cannot be considered separately from technical indicators. Some indicators are rarely used, while others are almost irreplaceable for many traders. We highlighted 5 the most popular technical analysis indicators: Moving average (MA), Exponential moving average (EMA), Stochastic oscillator, Bollinger bands, Moving average convergence divergence (MACD).
How to Use Technical Indicators?
Trading strategies usually require multiple technical analysis indicators to increase forecast accuracy. Lagging technical indicators show past trends, while leading indicators predict upcoming moves. When selecting trading indicators, also consider different types of charting tools, such as volume, momentum, volatility and trend indicators.
Do Indicators Work in Forex?
There are 2 types of indicators: lagging and leading. Lagging indicators base on past movements and market reversals, and are more effective when markets are trending strongly. Leading indicators try to predict the price moves and reversals in the future, they are used commonly in range trading, and since they produce many false signals, they are not suitable for trend trading.

