

比特幣/美元價格和現場圖標
This page includes full information about the 比特幣/美元, including the 比特幣/美元 live chart and dynamics on the chart by choosing any of 8 available time frames.
By moving the start and end of the timeframe in the bottom panel you can see both the current and the historical price movements of the instrument. In addition, you have an opportunity to choose the type of display of the 比特幣/美元 live chart – Candles or Lines chart – through the buttons in the upper left corner of the chart. All clients that have not yet decided which instrument to trade are in the right place since reading the full characteristics of the BTCUSD and watching its performance on the charts will help them to make their final decision.
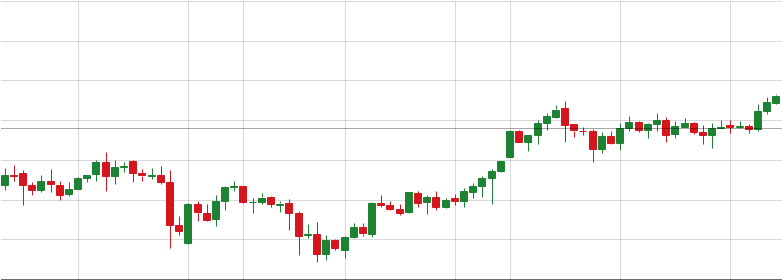
BTCUSD 價格圖表
- 1 MIN
- 5分钟
- 15 分鐘
- 30 分鐘
- 1 小時
- 4小時
- 1天
- 1週
比特幣/美元 的價格本週呈下跌趨勢
比特幣/美元 目前交易價格為 81424.0000,較前一日下跌 2.21%。從更廣泛的趨勢來看,本週變動幅度為 1.03%,過去 30 天則變動 1.01%。
| 選擇時間和日期範圍 | 開盤價 | 修改 % |
|---|---|---|
| 每日 | 82876 | 2.21% |
| 每周 | 81711.2 | 1.03% |
| 每月 | 83144 | 1.01% |
技術分析
技術分析是基於歷史資料研究和評估市場走勢。 其主要的目的是通過技術分析工具來預測未來市場活性水準。圖表和技術分析利用市場的分析方法來預測不同貨幣和貨幣對的價格。這種分析將允許您基於歷史價格進行市場預測.
查看最新的技術分析, BTCUSD: BTCUSD .
比特幣/美元 新聞
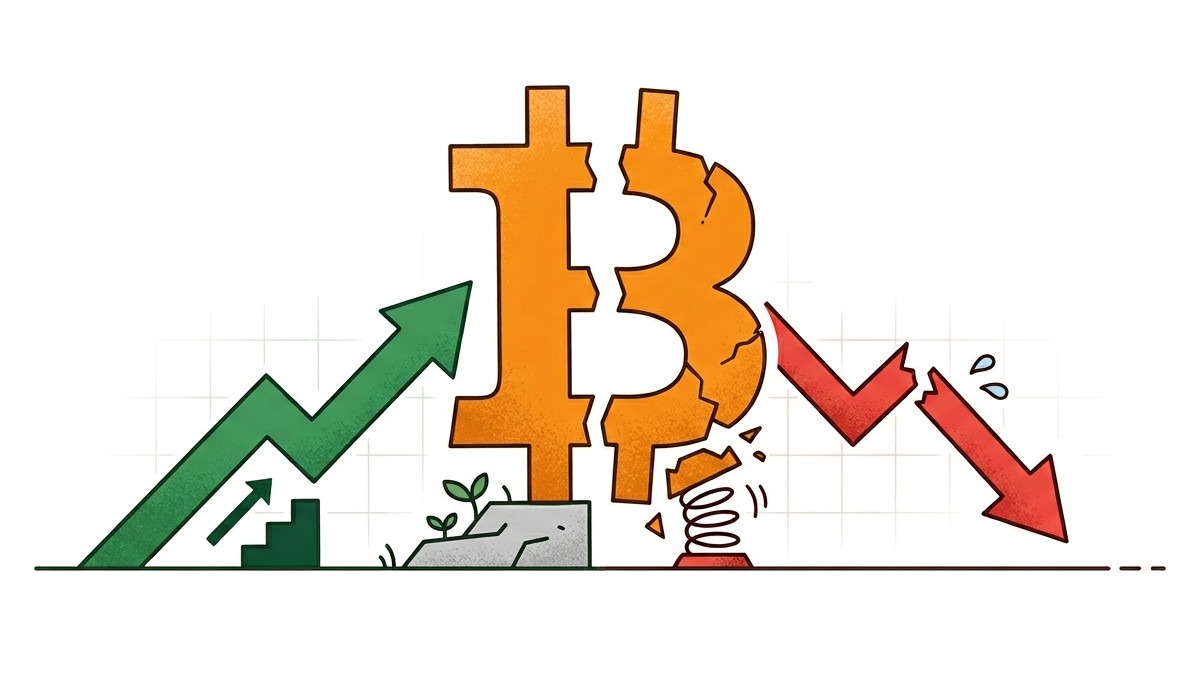
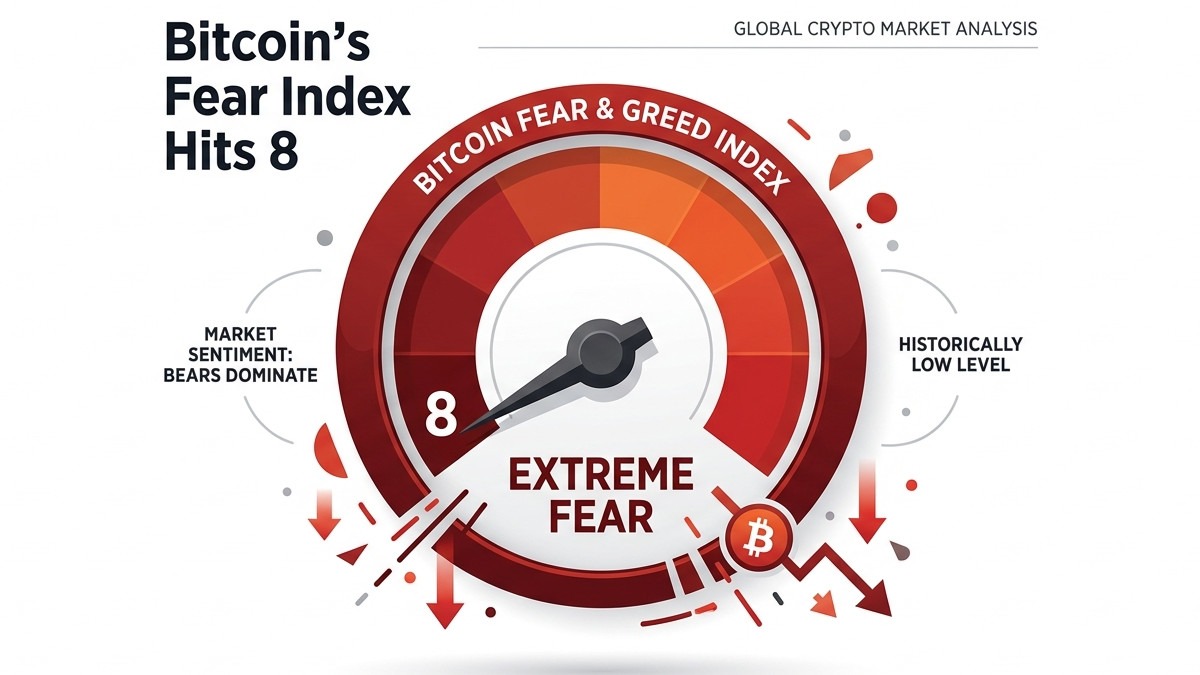


比特幣上看145,000美元,但需警惕短期回調風險
比特幣再度展現強勁走勢。這款全球最大的加密貨幣於週四攀升至119,500美元的六週高點,單週漲幅達10%。此輪上漲始於比特幣從108,650美元的局部低點反彈,並成功收復關鍵支撐位。...