- 分析
- 技術分析
AUD/NZD 技術分析 - AUD/NZD 交易: 2020-06-09
AUD/NZD 技術分析總結
低於 1,066
Sell Stop
高於 1,088
Stop Loss
| 指標 | 信號 |
| RSI | 賣出 |
| MACD | 賣出 |
| MA(200) | 買進 |
| Fractals | 中和 |
| Parabolic SAR | 賣出 |
| Bollinger Bands | 中和 |
AUD/NZD 圖表分析
AUD/NZD 技術分析
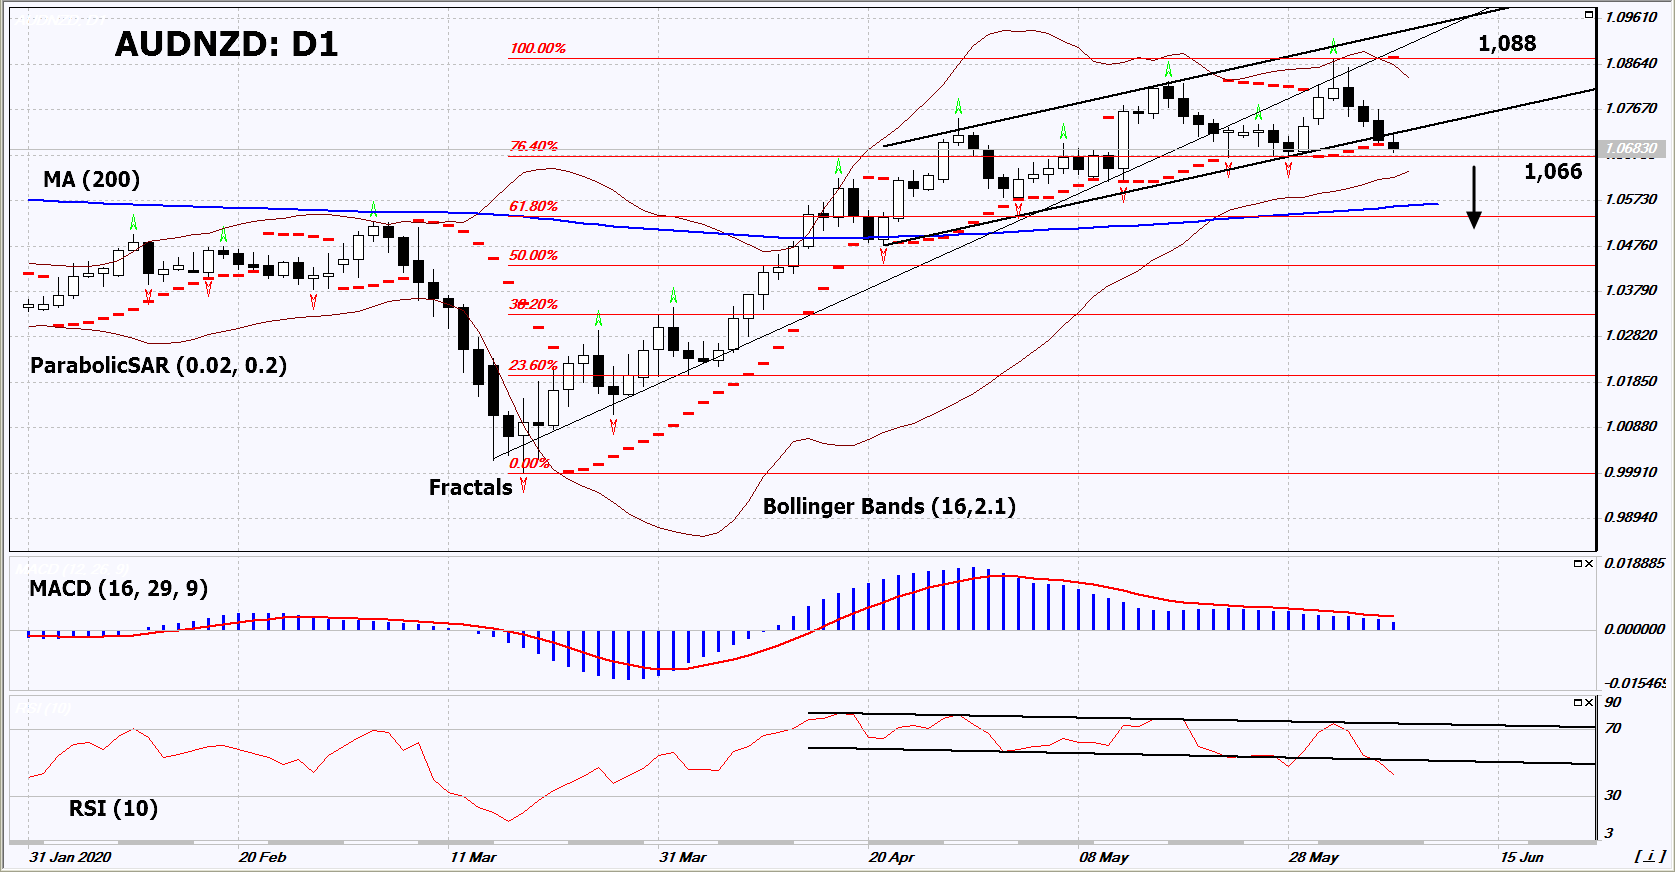
On the daily timeframe, AUDNZD: D1 is correcting down from the maximum since October 2018. The currency pair chart broke down the support line of the uptrend and the channel. A number of indicators of technical analysis formed signals for a further decrease. We do not exclude a bearish movement if AUDNZD falls below its last lower fractal and 1st Fibonacci level: 1,066. This level can be used as an entry point. We can set a stop loss above the last upper fractal, Parabolic signal and the upper Bollinger band: 1,088. After opening the pending order, we move the stop loss following the Bollinger and Parabolic signals to the next fractal minimum. Thus, we change the potential profit / loss ratio in our favor. After the transaction, the most risk-averse traders can switch to a four-hour chart and set a stop loss, moving it in the direction of the trend. If the price meets the stop level (1,088) without activating the order (1,066), it is recommended to delete the order: some internal changes in the market have not been taken into account.
外匯交易 基本面分析 - AUD/NZD
Market participants believe that the recovery of Australia's economy after the coronavirus pandemic may be slower than that of New Zealand. Will AUDNZD quotes decrease?
The downward movement on the chart means the strengthening of the New Zealand dollar against the Australian dollar. On Monday, the authorities of New Zealand reported the absence of patients with coronavirus (which means everyone recovered there). Since June 9, almost all restrictions introduced earlier due to the spread of COVID-19 have been lifted in the country. In Australia, the situation is also under the control of the authorities, but still there are about 500 patients with coronavirus. Since mid-May, the number of new COVID-19 patients in Australia has been around 7-8 people per day. Australia's GDP in the 1st quarter of 2020 showed an increase of 1.4% in annual terms, which was the minimum since 2009. New Zealand's GDP for the 1st quarter will be released on June 18 and some investors believe that it may be better than the Australia's GDP.
附注:
本文針對宣傳和教育, 是免費讀物. 文中所包含的資訊來自於公共管道. 不保障資訊的完整性和準確性. 部分文章不會更新. 所有的資訊, 包括觀點, 指數, 圖表等等僅用於介紹, 不能用於財務意見和建議. 所有的文字以及圖表不能作為交易的建議. IFC Markets及員工在任何情況下不會對讀者在閱讀文章中或之後採取的行為負責.

