- 分析
- 技術分析
NZD/CAD 技術分析 - NZD/CAD 交易: 2021-05-26
NZD/CAD 技術分析總結
高於 0.874
Buy Stop
低於 0.86
Stop Loss
| 指標 | 信號 |
| RSI | 買進 |
| MACD | 賣出 |
| MA(200) | 中和 |
| Fractals | 中和 |
| Parabolic SAR | 買進 |
| On Balance Volume | 中和 |
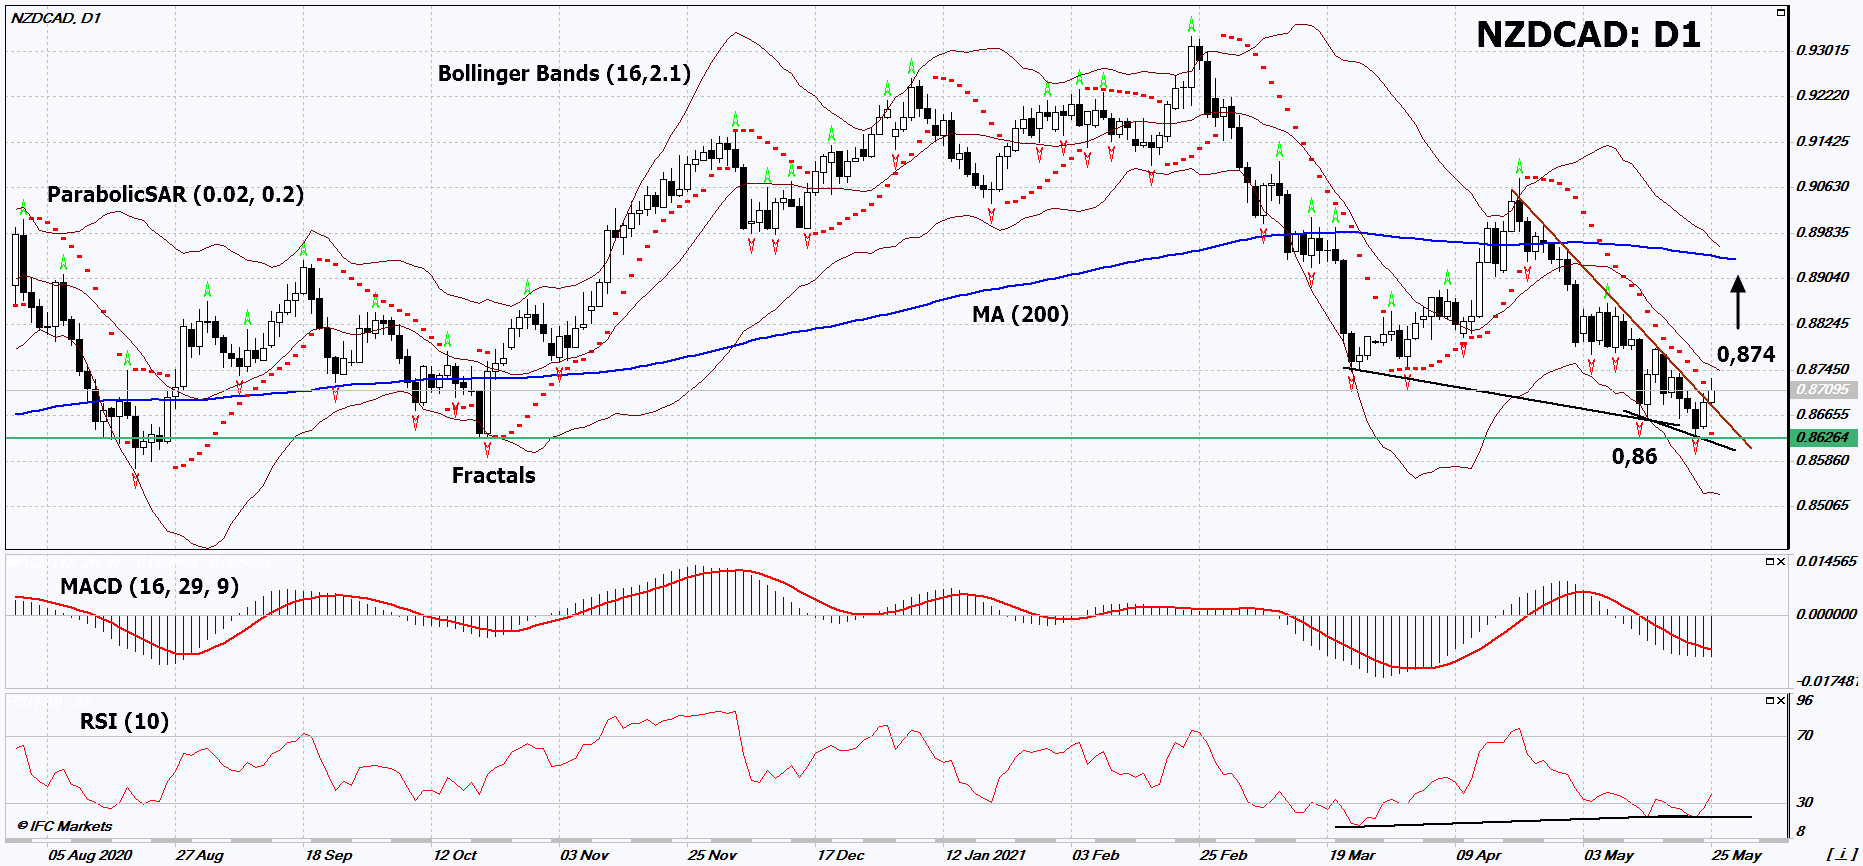
NZD/CAD 圖表分析
NZD/CAD 技術分析
On the daily timeframe, NZDCAD: D1 went up from the downtrend. A number of technical analysis indicators have formed signals for further increase. We do not rule out a bullish movement if NZDCAD: D1 rises above its latest maximum: 0.874. This level can be used as an entry point. The initial risk limitation is possible below the Parabolic signal and the last lower fractal: 0.86. After opening a pending order, we can move the stop-loss to the next fractal low following the Bollinger and Parabolic signals. Thus, we change the potential profit / loss ratio in our favor. After the transaction, the most cautious traders can switch to the four-hour chart and set a stop-loss, moving it in the direction of the trend. If the price overcomes the stop-loss (0.86) without activating the order (0.874), it is recommended to delete the order: there are internal changes in the market that were not taken into account.
外匯交易 基本面分析 - NZD/CAD
On May 26, 2021, a regular meeting of the Reserve Bank of New Zealand (RBNZ) will take place. Will the NZDCAD quotes rise?
Their rise means the strengthening of the New Zealand dollar against the Canadian dollar. A decrease in the RBNZ rate (0.25%) is not expected, but investors do not exclude that the New Zealand Central Bank will reduce the economic stimulus program. It could also improve its economic forecast for 2021. Inflation in New Zealand in the Q1 of this year amounted to 1.5% in annual terms. RBNZ's Large-scale asset purchases program (LSAP) has a volume of NZ $100 billion. So far, it is assumed that it will be active until the middle of next year. A negative factor for the Canadian dollar may be an increase in inflation in April to 3.4% in annual terms. This is much higher than the Bank of Canada rate, which is 0.25%.
附注:
本文針對宣傳和教育, 是免費讀物. 文中所包含的資訊來自於公共管道. 不保障資訊的完整性和準確性. 部分文章不會更新. 所有的資訊, 包括觀點, 指數, 圖表等等僅用於介紹, 不能用於財務意見和建議. 所有的文字以及圖表不能作為交易的建議. IFC Markets及員工在任何情況下不會對讀者在閱讀文章中或之後採取的行為負責.

